Money Centered Blog — Center for Financial Planning, Inc.

A Privately Held Wealth Management Firm for Generations Form CRS Newsletter Signup

Nicholas Boguth, CFA®

The Single Most Important Investing Decision

Nicholas Boguth Contributed by: Nicholas Boguth

Most Important Investing Decision Center for Financial Planning, Inc.®

Unsurprisingly, I think investing is fun. This is one of the reasons I’ve chosen a career in investment management. With that being said, my career is only 6 years in. Is it possible that I only think investing is fun because the stock market has hit a new all‐time high every single year of my career? Do stocks ever fall? Why even own bonds that pay 2% coupons?

With the decade being over, and the S&P 500 rising almost 190% over the prior ten years, it seems like a good time to remind ourselves of a few key investing principles.

  • Stocks are risky. Their prices can fall.

  • Bonds are boring, but they have potential to help preserve your portfolio.

  • Asset allocation is the single most important investing decision you will make.

Asset allocation in its simplest form is the ratio of stocks to bonds in your portfolio. More stocks in your portfolio means more risk. More bonds in your portfolio means more potential to balance out the risk of stocks. As financial planners, one of the first decisions we’ll help you make is the decision of what asset allocation is most likely going to lead to your financial success.

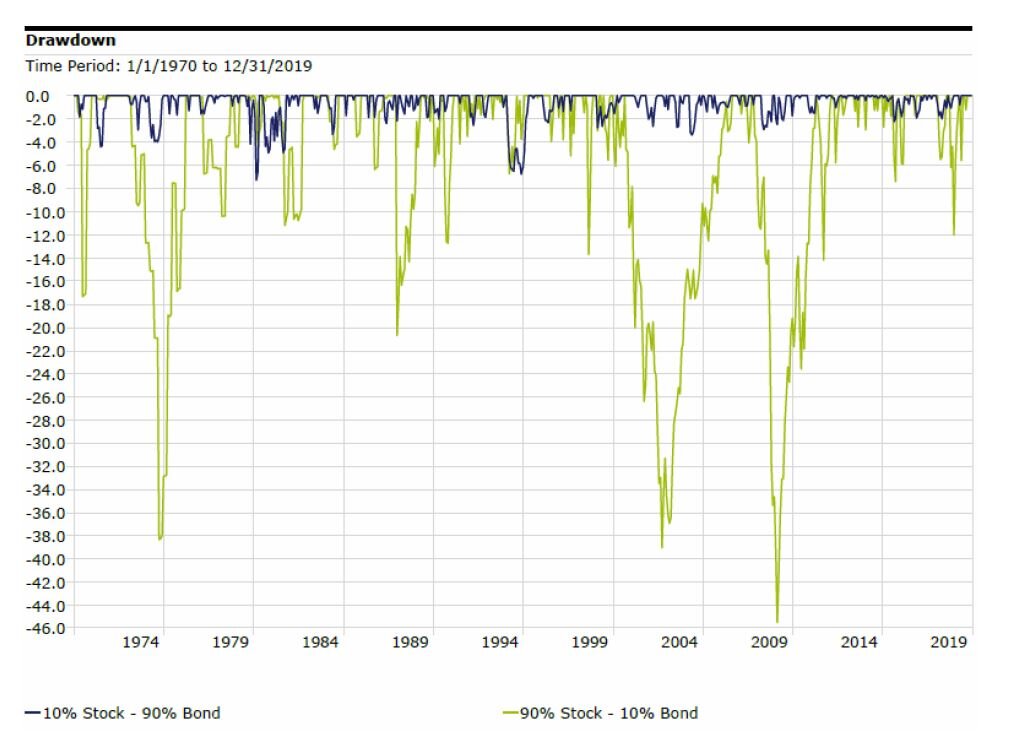
Take a look at the drawdowns of a portfolio of mostly stocks (green line) compared to a portfolio of mostly bonds (blue line). Stocks may have roared through the 2010’s, but no one has a crystal ball to tell us what they will do in the 2020’s. This chart is a good reminder of what stocks CAN do. Be sure that your portfolio is set up to maximize your chance of success no matter what stocks do. If you are unsure about your current portfolio, we’re here to help.

Source: Morningstar Direct. Stock index: S&P 500 TR (monthly). Bond Index: IA SBBI US IT Govt Bond TR (monthly).

Source: Morningstar Direct. Stock index: S&P 500 TR (monthly). Bond Index: IA SBBI US IT Govt Bond TR (monthly).

Nicholas Boguth is a Portfolio Administrator at Center for Financial Planning, Inc.® He performs investment research and assists with the management of client portfolios.


Investing involves risk and you may incur a profit or loss regardless of strategy selected, including diversification and asset allocation.

The information has been obtained from sources considered to be reliable, but we do not guarantee that the foregoing material is accurate or complete. The IA SBBI US IT Government Bond Index is an index created by Ibbotson Associates designed to track the total return of intermediate maturity US Treasury debt securities. One cannot invest directly in an index. Past Performance does not guarantee future results.

Great Expectations

Nicholas Boguth Contributed by: Nicholas Boguth

Great Expectations Center for Financial Planning, Inc.®

We hear a lot about how stocks perform “on average”, and what to “expect” from stock returns:

  • “On average, stocks return x%.”

  • “You can expect stocks to return x% over the long run.”

  • “We expect stocks to return x% per year.”

But what to expect and what is average are two very different things. In fact, average happens so rarely, that I would almost never expect the average. Let’s take a look at some numbers.

Below is a chart of one-year rolling returns for the S&P 500 since 1936. Every spot on that line represents the prior 12 months of returns. As you can see, it is quite sporadic. The “average” return for this set of data is +11.9%, but it ranges from -50% to more than +61%!

Return data from Morningstar Direct

Return data from Morningstar Direct

When it comes to investing, realistic expectations are very important.

They keep us grounded and help us keep emotions out of the decision-making process. Don’t expect average returns every time you look at your stocks. Statistically speaking, since two standard deviations capture ~95% of data, it is safe to say you can expect somewhere between two standard deviations on any given period. If you are looking at one-year returns, that would be between -23% and +47%.

It is also important to remember your time horizon. Expectations over one year should be very different than expectations over 30 years. For reference, the entire range of 30-year returns for the S&P 500 since 1936 is between +9.1% and +14.7%.

S&P 500 TR index, monthly returns, 3/31/1936 to 10/31/2019

S&P 500 TR index, monthly returns, 3/31/1936 to 10/31/2019

Lastly, we need to remember that this is only one asset class. If you have a diversified strategy, there is a good chance that large U.S. companies only make up a small percentage of your strategy. International companies, small and mid-sized companies, various bonds, and alternative strategies all merit different expectations. As financial advisors, it is our job to help you understand what to expect. Not sure what to expect? Give us a call.

Nicholas Boguth is an Investment Research Associate at Center for Financial Planning, Inc.® He performs investment research and assists with the management of client portfolios.


Return data from Morningstar Direct. S&P 500 TR index, monthly returns, 3/31/1936 to 10/31/2019. Any opinions are those of Nicholas Boguth, Investment Research Associate, and not necessarily those of Raymond James. Expressions of opinion are as of this date and are subject to change without notice. There is no guarantee that these statements, opinions or forecasts provided herein will prove to be correct. Investing involves risk and you may incur a profit or loss regardless of strategy selected, including diversification and asset allocation. Keep in mind that individuals cannot invest directly in any index, and index performance does not include transaction costs or other fees, which will affect actual investment performance. Individual investor's results will vary. Past performance does not guarantee future results. Future investment performance cannot be guaranteed, investment yields will fluctuate with market conditions. The S&P 500 is an unmanaged index of 500 widely held stocks that is generally considered representative of the U.S. stock market. International investing involves special risks, including currency fluctuations, differing financial accounting standards, and possible political and economic volatility.
Share

Even the Best Investors Lose Money

Nicholas Boguth Contributed by: Nicholas Boguth

Even the Best Investors Lose Money

In an ideal financial planning universe, we would only invest in things that go up. We would never see our account values go down. We would never even see a negative number on our statements. Bonds would pay interest, and interest rates would be so stable that bond prices didn’t move. Stocks would pay dividends, and every company’s earnings would only grow.

Unfortunately for us, investing is not that simple. There is no growth without risk. Nothing, and I mean NOTHING, is guaranteed to appreciate. Even the world’s best investors lose money from time to time, but what makes them the best investors is how they react when those losses happen.

Let’s take a look at Warren Buffett, one of the most successful investors of all time, and how his stock has done compared to the S&P 500 (a collection of the 500 largest public U.S. companies) over the past 25 years. Is it all positive? Does he beat the S&P 500 every year? If he did lose to the S&P 500, was it close? Would you stick with him for the following year?

Data: Morningstar Direct. Total Return.

Data: Morningstar Direct. Total Return.

What stands out to you? Two things jumped out at me:

  1. Both were negative five out of the past 25 years.
    Even one of the best investors in the world lost money the SAME number of times as the S&P 500.

  2. Buffett returned less than the S&P 500 nine times, and one of those times was by more than 40%!
    If you looked at your statement and saw that your $10,000 turned into $8,000, while everyone who owned just the 500 biggest U.S. companies now had $12,000, would you stick with Buffett or would you switch investments?

Investing is hard because of risk. Investments depreciate or underperform for years at a time. You can’t avoid this fact. One thing you can avoid is making decisions that ultimately may be harmful to your goals, by having a plan in place for those years when investments aren’t going the way you’d like.

Don’t have a plan? We would be glad to help.

Nicholas Boguth is an Investment Research Associate at Center for Financial Planning, Inc.® He performs investment research and assists with the management of client portfolios.


Any opinions are those of Nicholas Boguth and not necessarily those of Raymond James. This material is being provided for illustration purposes only and is not a complete description, nor is it a recommendation of any investment mentioned. There is no guarantee that these statements, opinions or forecasts provided herein will prove to be correct. Investing involves risk and you may incur a profit or a loss regardless of strategy selected. Prior to making an investment decision, please consult with your financial advisor about your individual situation. The S&P 500 index is comprised of approximately 500 widely held stocks that is generally considered representative of the U.S. stock market. It is unmanaged and cannot be invested into directly. Past performance is no guarantee of future results.

Share

Holiday Online Shopping Scams

Contributed by: Nicholas Boguth Nicholas Boguth

20171212.jpg

Tis’ the holiday season, which means plenty of online shopping for a lot of us. For those of you who have been or will be online shopping for the holidays, we want you to take special care to avoid attempted fraud.

Most of these online shopping scams will come through your email in the form of a fake offer, receipt, or shipping notice.

The most important thing is to avoid clicking on anything that seems out of the ordinary, and if you get an offer that seems too good to be true – it probably is.  You may also see these “too good to be true” offers on social media, and they could even look like a friend shared it with you. In these cases, do some research before clicking, and avoid filling out personal information on non-reputable websites.

Protect yourself by shopping with a credit card; it is easier to deal with fraud if you ever do fall victim.

If you are emailed a receipt or shipping notice for something that you did not purchase, do not click the email. Instead, check your credit card transactions to see if this purchase actually did happen. If it did happen, contact your credit card company immediately to report the fraud.

This is also a good time to remind everyone to periodically change your passwords for online accounts, and be sure to use different passwords for different accounts. If possible, only shop at well-known online stores, or retailers that you have had success with in the past. Be on the lookout for anything out of the ordinary. If you do come across something you believe to be fraudulent, report it to the FBI’s internet crime complaint center (https://www.ic3.gov/default.aspx).

Keep these tips in mind and happy holiday shopping!

Nicholas Boguth is an Investment Research Associate at Center for Financial Planning, Inc.® and an Investment Representative with Raymond James Financial Services.


Third party links are being provided for informational purposes only. Raymond James is not affiliated with and does not endorse, authorize or sponsor the listed website or its respective sponsor. Raymond James is not responsible for the content of any website or the collection or use of information regarding any website's users and/or members.

Share

Risk Expectations – Markets Go Down Every Year

Contributed by: Nicholas Boguth Nicholas Boguth

20171114.jpg

Investing is risky: the price of securities can go down, but there are strategies to help mitigate this risk: diversifying and sticking to your plan.

The chart below shows the price return (gray bar) and the largest intra-year decline (red dot) of the S&P 500 since 1980. This is one of my favorite charts because it reminds me that stock prices have indeed gone down at some point during EVERY year, but ultimately returned a positive number a vast majority of the time.

It states an appalling statistic: the average intra-year decline of the S&P 500 over this period is more than 14%. I say appalling because despite the average decline being -14%, the average return by the end of each year is over 8%, and this does not even include dividends! This acts as a great reminder to stay invested and don’t change your plan when the markets take a dive.

Our ultimate goal is to diversify in order to reduce that average intra-year drawdown, without sacrificing too much return. It is not easy for most investors to stomach watching their money decline by 14%, which is why risk management is a key part of the investment process. The right amount of risk is going to be different for everyone; working with us to determine your financial goals and capacity/willingness to take risk is step one in building your personalized portfolio.

Nicholas Boguth is an Investment Research Associate at Center for Financial Planning, Inc.® and an Investment Representative with Raymond James Financial Services.


This information has been obtained from sources deemed to be reliable but its accuracy and completeness cannot be guaranteed. The S&P 500 is an unmanaged index of 500 widely held stocks that is generally considered representative of the U.S. stock market. Keep in mind that individuals cannot invest directly in any index, and index performance does not include transaction costs or other fees, which will affect actual investment performance. Individual investor's results will vary. Past performance does not guarantee future results. Dividends are subject to change and are not guaranteed. Diversification does not ensure a profit or guarantee against loss. There is no assurance that any investment strategy will ultimately be successful, profitable nor protect against loss.

Share

Investor Basics: Exchange Rates

Contributed by: Nicholas Boguth Nicholas Boguth

20171011.jpg

An exchange rate is just the price of one currency in terms of a different currency. For example, as I wrote this blog on 9/29/17, the USD/EUR exchange rate was .85. This means that 1 US Dollar would buy 0.85 Euro.

Exchange rates fluctuate though, and this is where things get complicated for investors. Inflation, interest rates, asset flows, trade, and economic stability are all factors that move exchange rates. Below is a chart showing just how much the exchange rate between the US Dollar and the Euro has fluctuated in the past 10 years.

blog 2.png

Now these exchange rates may not directly affect you in your day to day purchases, but if you are invested internationally, exchange rates affect your portfolio. Head on over to our Director of Investments Angela Palacios’s blog (coming on Thursday!) to read about exactly how exchange rates have affected returns recently.

Nicholas Boguth is an Investment Research Associate at Center for Financial Planning, Inc.® and an Investment Representative with Raymond James Financial Services.

Share

Investment Pulse: 3Q 2017

Contributed by: Nicholas Boguth Nicholas Boguth

20171009.jpg

We’ve been busy here in the Investment Department! Check out some of our research highlights from the third quarter.

Angela Palacios, Director of Investments at The Center, attends Capital Group Advisor Forum

Angela traveled to Capital Group’s headquarters in California, to look under the hood at their investment strategies focusing on their process, people and investment outlooks.  You may know the strategies as the American Funds family. The discussion spanned from macro-economics to fixed income and equity discussions. On the macroeconomic front they discussed their recession outlook. Anne Vandenabeele, Economist, stated that expansions don’t die of old age, they die because imbalances build up in the economy or the Federal Reserve raises rates too quickly. They don’t see either of these scenarios right now. Most severe bear markets are when you have a bear market combined with a recession. While there may be a bear market in the next several years they don’t see a recession occurring at the same time. 

Clayton Shiver, Portfolio Manager at Stadion Money Management

Part of our investment process is to stay on top of investment products being offered in the marketplace. Nick Boguth met with Clayton Shiver to discuss Stadion’s alternative product platform and understand the team’s investment process. Clayton discussed their three sleeve alternative approach that included an equity, income, and trend sleeve implemented with the buying and selling of stocks and options in order to generate very different potential returns from the S&P 500 or Barclays US Aggregate Bond Index.

Matt Lamphier, Portfolio Manager at First Eagle

Matt Lamphier, director of research for the Global Value team at First Eagle Investment Management, joined us at our office for a jam-packed hour of investment updates. We discussed First Eagle’s investment process, outlook, and rationale behind their investments. Matt stressed the importance of being a value investor, and choosing companies that will outperform over the long term. One surprising statistic that Matt shared was that the average timespan of a stock in their portfolio is over 10 years!

What to expect next time…

We have a busy schedule next quarter and are looking forward to sharing highlights from our upcoming conferences including: Thornburg Investment Management, First Eagle, and Investment News.

Nicholas Boguth is an Investment Research Associate at Center for Financial Planning, Inc.® and an Investment Representative with Raymond James Financial Services.


The information has been obtained from sources considered to be reliable, but we do not guarantee that the foregoing material is accurate or complete. Any opinions are those of Nick Boguth and not necessarily those of Raymond James. Investing involves risk and you may incur a profit or loss regardless of strategy selected. The S&P 500 is an unmanaged index of 500 widely held stocks that is generally considered representative of the U.S. stock market. The Barclays US Aggregate Bond Index is a broad-based flagship benchmark that measures the investment grade, US dollar-denominated, fixed-rate taxable bond market. Keep in mind that individuals cannot invest directly in any index, and index performance does not include transaction costs or other fees, which will affect actual investment performance. Individual investor's results will vary. Past performance does not guarantee future results. Raymond James is not affiliated with Anne Vandenabeele, Clayton Shiver, Stadion Money Management, Matt Lampier and/or First Eagle Investment Management.

Share

Irma’s Devastating Winds Don’t Devastate The Market

Contributed by: Nicholas Boguth Nicholas Boguth

20170926.jpg

Hurricane Irma, one of the strongest and longest-lasting hurricanes ever recorded, recently passed leaving a long path of destruction behind it. People from the Caribbean to Florida prepared for the beast of a storm prior to labor day weekend, but there is only so much that could be done before its 180+ mph winds tore through the Virgin Islands on Wednesday the 6th, Cuba on Friday, and finally Florida and Georgia by Sunday. Entire islands were left in shambles across the Caribbean, Florida and Georgia sustained major damage, and millions of people are left without power and water.

How did the market respond?

We are constantly reminded that the markets do not like uncertainty, and this rings true when you look at short periods of volatility, but look at all of the uncertainty that we’ve seen in the past 15 years. Since ’02, we’ve had 3 presidents from republican, to democrat, back to republican, Congress party control flipped multiple times, we’ve seen 2 major wars, devastating natural disasters, massive oil spills, major business and even city bankruptcies, and a “Great Recession”. What did the S&P 500 do over the past 15 years? It is up about ~9% annualized, which is right on par with the average return of the S&P over the past 100 years.

Reminder: be a long term investor. Do not try to time the market, and if you ever have any questions – we are here to help!

Nicholas Boguth is an Investment Research Associate at Center for Financial Planning, Inc.® and an Investment Representative with Raymond James Financial Services.


The information contained in this blog does not purport to be a complete description of the securities, markets, or developments referred to in this material. The information has been obtained from sources considered to be reliable, but we do not guarantee that the foregoing material is accurate or complete. Any opinions are those of Nick Boguth and not necessarily those of Raymond James. Expressions of opinion are as of this date and are subject to change without notice. There is no guarantee that these statements, opinions or forecasts provided herein will prove to be correct. Investing involves risk and you may incur a profit or loss regardless of strategy selected. The S&P 500 is an unmanaged index of 500 widely held stocks that is generally considered representative of the U.S. stock market. Keep in mind that individuals cannot invest directly in any index, and index performance does not include transaction costs or other fees, which will affect actual investment performance. Individual investor's results will vary. Past performance does not guarantee future results.

Share

Investor Basics: Embedded Bond Features

Contributed by: Nicholas Boguth Nicholas Boguth

This time around in our “Investor Basics” series, we’re going to take a look at the most common bond features. For a dive into a more complex bond pricing topic, check out our Director of Investment’s Investor Ph. D blog on why buying premium bonds can make sense.

First off, what is an embedded bond feature?

An embedded bond feature is a provision attached to a bond that changes its maturity, risk, or liquidity. A bond issuer may release a bond with an embedded feature in order to make it more attractive to a bond buyer, or to give itself a more favorable debt structure. The most common types of embedded features that you may have seen in the market, and that I will briefly go over in this blog, are call, put, and conversions.

Call features give the issuer of the bond the right to “call” the bond back from the bondholder at a specific date. This provision benefits the issuer because they are able to buy back debt, and then issue new debt at a lower interest rate. A company will typically issue a callable bond when they believe that interest rates will decrease in the future. Since this feature benefits the issuer, the company will have to make the yield or maturity more attractive to entice a buyer.

Put features give the bondholder the right to “put” the bond back to the issuer at a specific date before it matures. This provision benefits the bondholder because it allows him or her to put the bond back to the issuer (maybe interest rates have risen or the company’s credit is deteriorating). Since this option benefits the bondholder, he or she may have to accept a lower yield or longer maturity on the bond.

Another common embedded bond feature is the conversion option. This actually lets the bondholder convert the bond into shares of the company’s stock at a predetermined price and date. A company may issue convertible bonds as a way to issue cheap debt (they may not have to pay as large of a coupon because they are giving the bondholder the option to convert their bond to stock).

Each of these bond features may have a place in an investor’s portfolio, but knowing when and how to include them can be complex and differs from investor to investor. If you have any questions on these bond topics or any others, feel free to reach out to us at any time!

Nicholas Boguth is an Investment Research Associate at Center for Financial Planning, Inc.® and an Investment Representative with Raymond James Financial Services.


The information contained in this report does not purport to be a complete description of the securities, markets, or developments referred to in this material. Any information is not a complete summary or statement of all available data necessary for making an investment decision and does not constitute a recommendation. Every investor’s situation is unique and you should consider your investment goals, risk tolerance and time horizon before making any investment. Investing involves risk and you may incur a profit or loss regardless of strategy selected. Investments mentioned may not be suitable for all investors. There is an inverse relationship between interest rate movements and fixed income prices. Generally, when interest rates rise, fixed income prices fall and when interest rates fall, fixed income prices generally rise.

Share

Talking Bitcoin

Contributed by: Nicholas Boguth Nicholas Boguth

What is it?

Think of Bitcoin as internet cash. It is a currency that does not exist in a physical form - a cryptocurrency.

It is decentralized which means that there is no central authority that manages it. Instead, there is a set number of Bitcoin in the market. The creator of Bitcoin created 21 million bitcoins, and no more will ever be created.

Each transaction is “peer to peer,” and each peer or “user” is anonymous. There is no middlemen such as banks or credit card companies that monitor and clear each transaction. Instead, there are companies, groups, and private individuals who reconcile transactions and are awarded bitcoins in exchange.

“$100 in bitcoin in 2010 is worth $75 million today.”

I love these headlines. Here is another fun fact: the first material items purchased with bitcoin was two pizzas. The “user” paid 10,000 BTC – about $25 at the time. In today’s dollars (6/15/17), that pizza cost over $22,000,000.

You may have seen these headlines, but what drove this value increase? To put it simply: demand. Demand is affected by a number of things (who accepts it as a form of payment, transaction volume, liquidity, tax treatment, security, news articles, etc.), but the demand has rose significantly since 2010 which has driven the price increase. As I mentioned before, there are a set amount of 21 million bitcoin, so the currency is designed to be deflationary. As its demand increases, its price will increase.

Investing in Bitcoin

While the headlines are fun to read, it is difficult to give investment advice regarding the currency. It is relatively new (created in 2009). There are very limited laws and regulations with regards to bitcoin. It is not widely accepted as a form of payment. There has been high volatility in the past. Ultimately the future of bitcoin is still very uncertain, but we will be staying up to date with the currency to keep you informed.

Nicholas Boguth is an Investment Research Associate at Center for Financial Planning, Inc.® and an Investment Representative with Raymond James Financial Services.


Any opinions are those of Nick Boguth and not necessarily those of RJFS or Raymond James. The information has been obtained from sources considered to be reliable, but we do not guarantee that the foregoing material is accurate or complete. This information is not intended as a solicitation or an offer to buy or sell any security referred to herein. Investments mentioned may not be suitable for all investors. Any information is not a complete summary or statement of all available data necessary for making an investment decision and does not constitute a recommendation. Past performance may not be indicative of future results. Sources: https://www.washingtonpost.com/news/on-small-business/wp/2017/05/23/100-of-bitcoin-in-2010-is-worth-75-million-today/?utm_term=.cce93f146de2 http://www.businessinsider.com/bitcoin-pizza-day-passes-2000-20-million-2017-5

Share