Money Centered Blog — Center for Financial Planning, Inc.

A Privately Held Wealth Management Firm for Generations Form CRS Newsletter Signup

Center Investment Department

Q4 2024 Investment Commentary

Click the image above to watch the video commentary!

Print Friendly and PDF

Think back to one year ago. It's January 2024. So far, the economy had avoided the recession everyone thought was coming. The S&P 500 just wrapped up a +26% year. Bonds provided some positive performance. Inflation was coming down, unemployment was still at historic lows, and the mood could be described as cautious optimism as investors expected a "growing but slowing" economy.

Most market forecasts (more on these later) expected 2024 to be good but definitely not great. ESPECIALLY in an election year, because you never know what sort of uncertainty that could bring!

Well, we just wrapped up 2024. How was it? From the lens of the financial markets, it was a strong year.

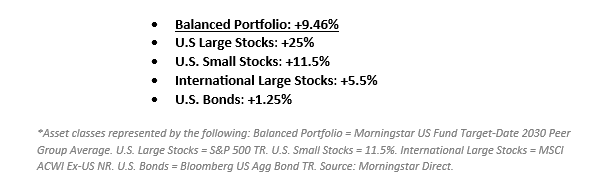
Stocks continued to climb, and bonds were slightly positive despite some bond market volatility. The S&P 500 was the standout among the major asset classes, but even small cap stocks and international stocks contributed positive performance.

Q4 brought some volatility and uncertainty between a major presidential election and multiple Fed rate cuts. U.S. stock indices climbed through the uncertainty, but international stocks and bonds fell slightly.

The big change during Q4 was the increase in bond yields as investors adjusted to what is looking like an even stronger economy than expected. A stronger economy generally comes with higher bond yields, which means less rate cuts from the Fed. This was reiterated in the Fed's Summary of Economic Projections in December that showed they expected the Fed Funds Rate to get to 3.9% by the end of 2025 (3 months prior, that projection showed an estimate of 3.4%).

We'll be watching this dynamic continue to evolve in the markets this year, but as of today investors are looking at a strong economy backed by an easing Federal Reserve, positive expectations for stock earnings, and decent bond yields providing strong fixed income options.

Interest Rates and The Economy

In December, the Federal Reserve (the Fed) held its final meeting of 2024, finalizing a year marked by significant continued disinflation and one of the strongest in recent years of economic activity. However, uncertainty always remains when looking ahead. Tariff and immigration policies proposed by the incoming administration are clouding investor's (and the Fed's) outlook for 2025.

With the Fed still in easing mode, equities should continue to be well supported (remember the old saying, "Don't fight the Fed"). While the Fed's December rate cut was a 'hawkish' cut (a cut with guidance there will be fewer future cuts), we continue to focus not on the number of cuts but more on the overall economic trajectory, which seems to be very resilient right now. With the economy still showing momentum, earnings should maintain their climb in 2025—reinforcing our positive longer-term outlook. However, in the short term, there can always be volatility, and after such a strong year, a little short-term volatility would not be unexpected.

So why doesn't this potential increased volatility scare us very much? A strong consumer!  Since the consumer makes up 70% of the U.S. Economy, we are a key ingredient to keep an eye on. The strength of the consumer in 2024 was evident through several key indicators. Consumer spending has shown consistent growth, while consumer confidence remains unshaken, driven by low unemployment rates, steady job growth, and rising wages. There could be some cracks on the horizon for consumer spending. We are starting to see consumers "trade down" a bit in their purchases, meaning they are still happy to spend but on cheaper options for goods and services. There aren't so many cracks to be concerned about yet, but it is certainly an area we watch closely.

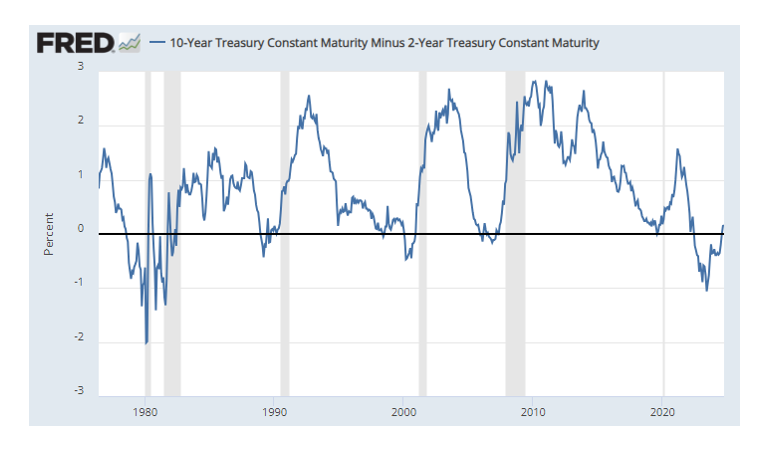
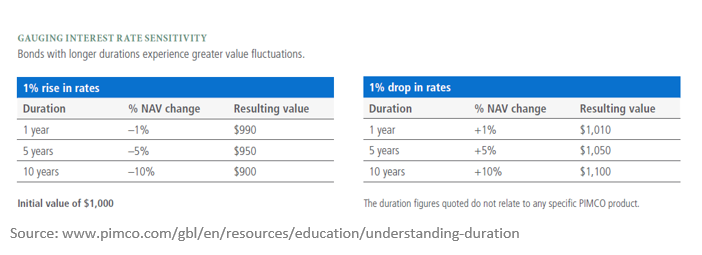
Bonds have had a bizarre year. Coming into 2024, we weren't sure what to expect other than the unexpected. As such, the caution we have exhibited in that portion of our portfolios has helped reduce some volatility in bonds in 2024. Treasury yields have moved contrary to normal historical patterns by rising instead of falling after the Fed started to cut rates in the fall. Better-than-expected economic data and inflation not falling as fast as the market would like to see have challenged investors to reassess the Fed's expected rate path. This means yields are likely to stay a bit more elevated than everyone originally thought. If you look at inflation and employment, the Fed has largely accomplished what it set out to do, even though markets might like to see them do more. The chart below shows where we are versus the Fed's targets.

S&P 500 Price Targets and Return Expectations

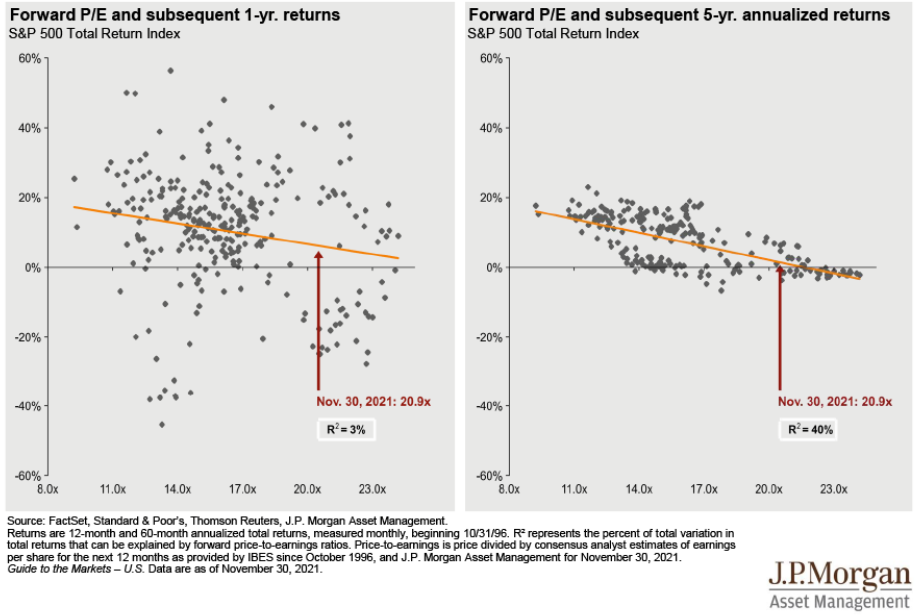
Major banks and brokerage firms put out S&P 500 price targets every year, and it may or may not surprise you, but they are rarely accurate. It is impossible to predict something as volatile as the stock market over such a short time. Last year, for example, analysts ranged from bearish to bullish, and the stock market blew straight through every one of their price targets by May.

Stock performance over one year can vary dramatically, but it has been remarkably consistent over the long term.

The other thing on investors' minds right now is…can the performance continue? Of course it can! No one knows for sure if it WILL over the next year (as I said, it is impossible to predict something so volatile as the stock market over such a short time frame), but just because stocks had a tremendous last year does not mean that they must lag the following year. In fact, the statistics show there is essentially no correlation between last year's performance and the next year's performance.

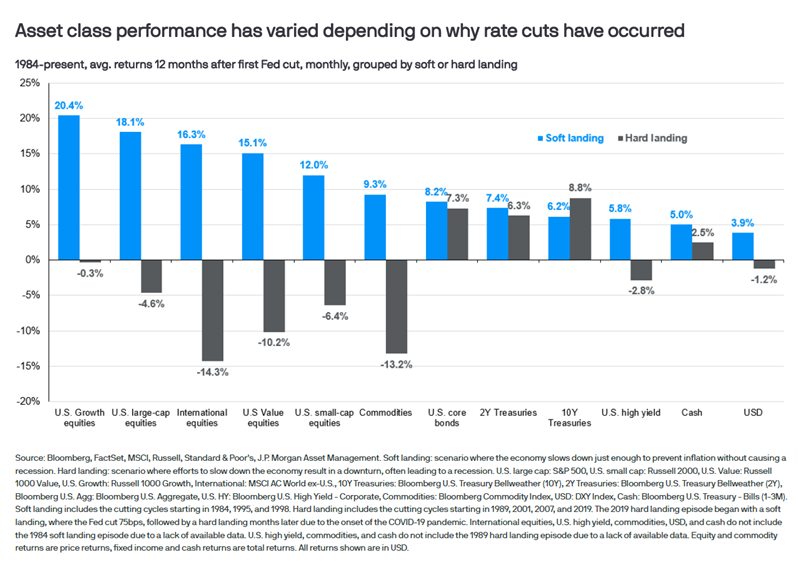
Election Outcome and Markets

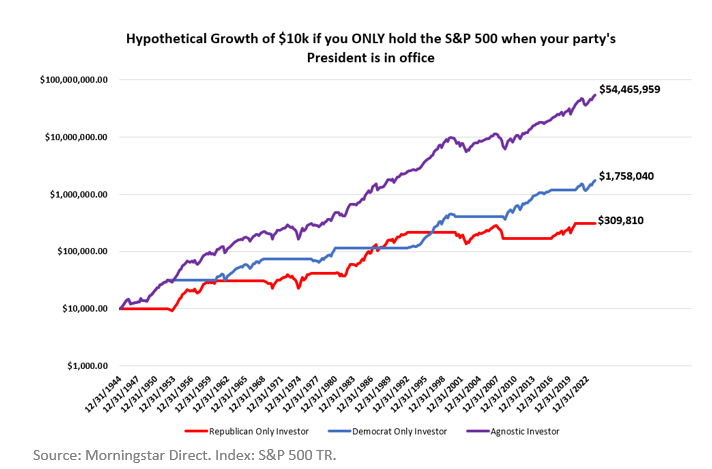
As the election dust settles, it is important to remember that the economy is usually the guiding force behind winners and losers in our portfolio.  Overall, rising corporate profits, continued economic expansion, and the potential for lower yields later this year provide a potentially positive backdrop for the markets, in our view.  Some areas, like international investments, may see additional headwinds from political forces like tariffs or a strong U.S. dollar.  At the same time, smaller companies in the U.S. may see some natural tailwinds from continued onshoring and disinflation. While there are many reasons for an optimistic outlook, being prepared for a downturn is evergreen. Our actions in your portfolio will reflect our continued research and developments in these areas as President Trump takes office. There are important things that we need to focus on, as always, such as making sure that you have 6-12 months of expenses set aside in cash so that we can weather any short-term volatility in markets (especially if you are retired), rebalancing to maintain proper diversification and paying close attention to tax loss harvesting and capital gains. 

A new administration may provide new risks, but when aren't there risks in investing? With new risks also come new opportunities, and our investment committee meets monthly to ensure portfolios are allocated to take advantage of constantly changing markets. Most importantly, your financial planner here at The Center is here to help you build a financial plan that gives you confidence no matter the market conditions. With that being said, onto 2025!

Angela Palacios, CFP®, AIF®, is a partner and Director of Investments at Center for Financial Planning, Inc.® She chairs The Center Investment Committee and pens a quarterly Investment Commentary.

Nicholas Boguth, CFA®, CFP® is a Senior Portfolio Manager and Associate Financial Planner at Center for Financial Planning, Inc.® He performs investment research and assists with the management of client portfolios.

Any opinions are those of the Angela Palacios, CFP®, AIF® and Nick Boguth, CFA®, CFP® and not necessarily those of Raymond James. The information contained in this report does not purport to be a complete description of the securities, markets, or developments referred to in this material. There is no assurance any of the trends mentioned will continue or forecasts will occur. The information has been obtained from sources considered to be reliable, but Raymond James does not guarantee that the foregoing material is accurate or complete. Any information is not a complete summary or statement of all available data necessary for making an investment decision and does not constitute a recommendation. Investing involves risk and you may incur a profit or loss regardless of strategy selected. The S&P 500 is an unmanaged index of 500 widely held stocks that is generally considered representative of the U.S. stock market. The Russell 2000 Index measures the performance of the 2,000 smallest companies in the Russell 3000 Index, which represent approximately 8% of the total market capitalization of the Russell 3000 Index. The MSCI EAFE (Europe, Australasia, and Far East) is a free float-adjusted market capitalization index that is designed to measure developed market equity performance, excluding the United States & Canada. The EAFE consists of the country indices of 22 developed nations. The Bloomberg Barclays US Aggregate Bond Index is a broad-based flagship benchmark that measures the investment grade, US dollar-denominated, fixed-rate taxable bond market. Keep in mind that individuals cannot invest directly in any index, and index performance does not include transaction costs or other fees, which will affect actual investment performance. Individual investor's results will vary. Investing in oil involves special risks, including the potential adverse effects of state and federal regulation and may not be suitable for all investors. Past performance does not guarantee future results. Diversification and asset allocation do not ensure a profit or protect against a loss. Investing involves risk and you may incur a profit or loss regardless of strategy selected. Past performance is not a guarantee or a predictor of future results. Raymond James and its advisors do not offer tax or legal advice. You should discuss any tax or legal matters with the appropriate professional.

Share

Q3 2024 Investment Commentary

Print Friendly and PDF

This year has been off to a solid start as the melt-up continues. Even during what is usually the worst performing month on average, September, markets rallied. Mega-cap US tech stocks have remained a standout this year again and have driven much of the returns for the S&P 500 for the first half of the year. But, since then, we have seen participation from other areas of the market, such as international, particularly emerging markets, and small company stocks that have made a strong showing since interest rate cuts were back on the table and inflation continued to abate. Bonds have been positive by about the interest they have paid this year, and the Federal Reserve has started to cut interest rates with a .5% cut in September. Interest rate expectations and inflation news have been the major drivers of market returns so far this year. You may have noticed that I have left the election out of this list because the election hasn’t really driven market volatility so far. If you want to learn more about the relationship between elections and markets, check out a replay of our webinar from last month!

As we approach election day, the headlines could potentially drive some short-term volatility and, certainly, our emotions, but historically, long-term markets are driven far more by factors like economic growth, Federal Reserve direction, and fundamentals like growth and valuation. It is very likely that the outcome of the election won’t be settled by the time we wake up the next day, so this could possibly cause some short-term volatility, but we wouldn’t expect this to be sustained. A last note on politics: it is worth mentioning that Congress averted a government shutdown through the passage of a stopgap bill to fund the government through December 20. At that time, we could possibly see some political posturing surrounding this topic again, so we expect to see more headlines surrounding this late in the year. Markets tend to shrug off these headlines as we have “been there, done that” many times before.

GDP

Since the economy is a bigger driver of long-term returns, we should check in on this. As you can see from the chart below, the Federal Reserve seems to be engineering this soft landing they were hoping for.  Inflation and wages continue to come down, unemployment has grown slowly this year, retail sales have slowed a bit, and GDP shows a slowing in this chart but has since had somewhat stronger readings as the year has gone on.

Sources: Bloomberg, Bureau of Economic Analysis, Bureau of Labor Statistics.  Data as of 29 March 2024 for GDP and 31 May 2024 for other statistics.  Retail sails = adjusted retail and food services sales.  Wages = average hourly earnings.

Interestingly, Economic data is almost always revised after the fact. Data points such as how many people in an entire country are looking for jobs, how much money every citizen in a country has earned/spent/saved, or how much the prices of everything in a country have changed – these are pretty hard to track. This quarter, the Bureau of Economic Analysis revised GDP upwards by .3% in 2021, .6% in 2022, and .1% in 2023. Turns out we (consumers) spent more money than previously calculated in the past few years. Remember when we had two negative quarters of GDP growth in early 2022 (which is the technical definition of a recession), but a recession was never declared? Now, with revisions, there weren't actually two negative quarters of GDP growth. The 2nd quarter of 2022 was revised into positive growth rather than negative growth.

Headlines and Inflation

Inflation is still under the microscope despite the Fed shifting gears from the past couple of years' rate-hike environment into the rate-cut environment it has established going forward. The market will likely be watching economic data as it rolls in and reacting accordingly, as it weighs the odds of increasing inflation (and the potential reaction of the Fed moving slower with its rate cuts) OR continued disinflation/deflation (and the potential reaction of the Fed moving faster with its rate cuts). Recently, there have been some headlines of OPEC increasing oil production, which could possibly put downward pressure on oil prices. At the same time, strikes are beginning at ports on the East Coast, which could potentially slow down supply chains and put upward pressure on prices.

Yield Curve UN-Inversion

About two and a half years ago, the yield curve inverted. You can see this in the chart below, with the blue line dropping below 0 (meaning short-term rates are yielding greater than long-term rates).  We wrote about it then and shared that despite the warning sign – stocks still were positive a majority of the time 1 and 2 years later. 2022 was a rough year for both the stock and bond markets, but here we are 2.5 years later, and the S&P 500 is back, making new all-time highs.

Source: https://fred.stlouisfed.org/series/T10Y2Y

Last month, the yield curve UN-inverted (see that blue line above moving back above 0). You may have seen news articles directing attention to THAT event as the event that typically precedes recessions. It is hard to focus on the signal over the noise when the noise is so loud in our daily lives, from 24/7 media coverage to daily newspapers and endless social media feeds, but looking back on the last ten times, the yield curve UN-inverted:

  • 8 out of 10 times, the S&P 500 was higher the next year.

  • 10 out of 10 times, the S&P 500 was higher ten years later.

Source: Morningstar Direct. S&P 500 TR (USD)

So, what does this mean for your portfolio?

After this first rate cut by the FED, the yield curve UN-inverted AND it is looking like the FED has successfully engineered a soft landing. History can generally be a useful guide to understand how different assets (beyond just US Large cap) performed in this time period. Typically, you see risk assets doing well for equities, while in fixed income, quality tends to shine. Certain asset classes may have a little more tailwind behind them because of starting valuations and a scenario layered in where we have had high but falling inflation, so while the outcome may rhyme, it probably won't be identical to below.

Emerging Markets

Emerging markets made some noteworthy moves recently. Outside China, India, and Taiwan are experiencing excellent performance driven by monetary policy easing and their technology sectors. However, China has had some significant developments, causing them to play a bit of catchup recently. Chinese leaders announced several monetary policy initiatives that drove their recent equity return spike. First was a 50 basis point (bps) cut to the reserve requirements (the amount of cash that banks must hold in reserve against deposits). Second, they cut existing mortgage loan interest rates by 50bps. Other initiatives were also put into place to kickstart their economy. While the path forward could be bumpy, several factors remain a potential tailwind, such as reasonable valuations and company fundamentals and easing monetary policy.

Small Cap Stock Performance

Small cap stocks have been lagging their large cap counterparts for most of the last decade, but this quarter we saw one of the biggest moves in recent history from the asset class. Early in the quarter, there was a huge divergence, and small cap stocks provided a boost to portfolios. The Russell 2000 index ended the quarter +9.3%, beating out the S&P 500 index that was only up +5.9%. Many attributed the outperformance to the market reacting to a potential lower interest rate environment as it looked more certain that the Fed would be cutting rates, the cheaper starting valuations of the small cap asset class, and the overall higher volatility expected from the smaller and less liquid stocks. Whatever the catalyst was, many investors who have been waiting a long time for small cap outperformance were rewarded this past quarter.

While most of us invest with an eye years or decades into the future, short-term market swings can still trigger strong emotional reactions and sometimes push normally calm investors to become short-term traders rather than long-term investors. A properly allocated portfolio and enough cash to fund short-term needs can help to allay an emotional response that might derail your long-term plan. Is your portfolio appropriately positioned for your situation? As always, we are here to help!

Angela Palacios, CFP®, AIF®, is a partner and Director of Investments at Center for Financial Planning, Inc.® She chairs The Center Investment Committee and pens a quarterly Investment Commentary.

Nicholas Boguth, CFA®, CFP® is a Senior Portfolio Manager and Associate Financial Planner at Center for Financial Planning, Inc.® He performs investment research and assists with the management of client portfolios.

Any opinions are those of the Angela Palacios, CFP®, AIF® and Nick Boguth, CFA®, CFP® and not necessarily those of Raymond James. The information contained in this report does not purport to be a complete description of the securities, markets, or developments referred to in this material. There is no assurance any of the trends mentioned will continue or forecasts will occur. The information has been obtained from sources considered to be reliable, but Raymond James does not guarantee that the foregoing material is accurate or complete. Any information is not a complete summary or statement of all available data necessary for making an investment decision and does not constitute a recommendation. Investing involves risk and you may incur a profit or loss regardless of strategy selected. The S&P 500 is an unmanaged index of 500 widely held stocks that is generally considered representative of the U.S. stock market. The Russell 2000 Index measures the performance of the 2,000 smallest companies in the Russell 3000 Index, which represent approximately 8% of the total market capitalization of the Russell 3000 Index. The MSCI EAFE (Europe, Australasia, and Far East) is a free float-adjusted market capitalization index that is designed to measure developed market equity performance, excluding the United States & Canada. The EAFE consists of the country indices of 22 developed nations. The Bloomberg Barclays US Aggregate Bond Index is a broad-based flagship benchmark that measures the investment grade, US dollar-denominated, fixed-rate taxable bond market. Keep in mind that individuals cannot invest directly in any index, and index performance does not include transaction costs or other fees, which will affect actual investment performance. Individual investor's results will vary. Investing in oil involves special risks, including the potential adverse effects of state and federal regulation and may not be suitable for all investors. Past performance does not guarantee future results. Diversification and asset allocation do not ensure a profit or protect against a loss. Investing involves risk and you may incur a profit or loss regardless of strategy selected. Past performance is not a guarantee or a predictor of future results. Raymond James and its advisors do not offer tax or legal advice. You should discuss any tax or legal matters with the appropriate professional.

Share

Q2 2024 Investment Commentary

Print Friendly and PDF

When the circumstances change, our perspective evolves. This anthem of the past year highlights the importance of adaptability and openness to new information. But as much as things have changed this year, much has stayed the same. Megacap tech stocks are still driving the S&P 500 gradually upward for the year. The S&P 500 has had the best start to a presidential reelection year by logging 31 record highs this year and low volatility. Interest rates are still high. Stocks are performing better than bonds, while the U.S. continues to trounce international and large company stocks, which continue to beat small company stocks. 

Elections

The remainder of the summer and fall will surely be dominated by election headlines. Because elections can be divisive and unnerving, it's important to remember that markets are often resilient even in the face of the most unsettling election scenarios. Watch for an invitation to our upcoming election event to hear more details on this topic, but here are some quick observations:

  • U.S. stocks trend upward on average in election years regardless of which candidate wins the White House

  • Balanced portfolios historically help investors meet their financial planning objectives while managing risk over presidential terms

  • It's time in the market and not timing that matters the most for an investor; sitting on the sidelines with long-term assets sitting in cash can be costly to a long-term investment strategy

If you look at average and median returns through a presidential cycle, you can see that election years tend to be strongly positive. Historically, median returns are over 10% in an election year, with average returns over 7% in an election year. 

Returns also tend to come more strongly in the second half of the election year, as shown in the chart below. This year has broken the mold with strong returns through the first half of the year. Usually, when this happens, there tends to continue to be strong returns also through the second half of the year.

What Has Led to These Strongly Positive Returns?

While higher interest rates and high inflation seem like a staple part of the economy now, it is easy to forget that we enjoyed decades of low interest rates, low inflation and globalization that drove those trends.

Inflation has resumed its slow march downward despite a small pause this year and some numbers that had looked like they might be turning back upward. It seems unlikely that inflation will accelerate and should continue to resume the disinflation trend. Now, most of the inflation comes from shelter costs, and we have seen rent prices level off and slow slightly. Rent prices starting to come down should help this source of inflation. You also may have noticed your insurance rates increasing. Car insurance has contributed notably to recent inflation numbers. 

Many consumers still feel the sting of higher prices because slowing inflation only means prices aren't going up at the pace they were. The price increases we experienced over the past several years are here to stay and will need to be permanently factored into budgets going forward. Many households have found substitutes by shopping around at bargain retailers, and some have been lucky enough to experience wage inflation (although not enough to offset economic inflation.

Interest Rates and The Fed

It is hard to talk about inflation without discussing The Federal Reserve and the current interest rate environment. As of the end of the quarter, the 1-year treasury rate was ~5.1%, and the 10-year treasury rate was ~4.4%. You are still getting paid MORE in short-term bonds than you are in longer-term bonds – that is strange! In a normal interest rate environment, you would get a higher coupon from longer bonds because, in return, you are taking on more risk and uncertainty from the longer time until maturity.

This environment has made it much more attractive to hold money market funds, CDs, and other short-term instruments, BUT those are not without risks of their own. If the 10-year rate falls, for example, then the risk of being in the short-term bond is that you will miss out on the price gains of the 10-year bond, and if short-term rates fall as well, then you will have to reinvest your money at a lower interest rate once your bond matures. Without knowing the path of interest rates going forward, there is no way to know with certainty which type of bond will outperform. However, we are here to help make sure your portfolio is positioned well for YOUR financial plan.

Speaking of the path of interest rates, despite inflation heading in the direction that the Fed wants, they kept the Fed Funds rate steady at the same rate as it has been for almost the past year: 5.25-5.5%. There are advocates on each side of the argument saying that they should have cut rates already OR that they should even keep further hikes on the table. Jerome Powell continues to stress data dependence and their commitment to the 2% inflation target, and this sentiment is shown in bond rates as rate cut expectations have continually been priced out of the market year-to-date. No one has control over inflation numbers, the Fed, interest rates, or the stock market – you have to  invest given the hand you are dealt.

AI and Meme Stocks

Several investment crazes have filtered into this stock market rally; some have long-term validity, and some don't. The evolving landscape surrounding artificial intelligence has strongly impacted any company investing heavily in it. Nvidia corporation has been the poster child of a rally surrounding artificial intelligence, which has been up very strongly this year, even though it has recently pulled back some. Nvidia is viewed as a pioneer in the space as its business shifted from gaming consoles to data centers where its chips now power large language models like ChatGPT.  Meanwhile, Gamestop found itself in the middle of the meme stock craze again. While returns attributed to meme stock hype are usually short-lived, the idea of social media heavily influencing trading performance is something the markets are still trying to make sense of. While investing in a long-term productivity enhancement like artificial intelligence can drive long-term fundamental returns, meme stocks are more about hype and short-term volatility.

Hopefully, you take a few moments to check out the Olympics this month. I am often in awe of the amazing talent seen from around the world. That kind of talent comes from a lifetime of diligence and hard work, much like successful investing. Natural ability or luck can only take you so far and can't be counted on. Athletes must train in various muscle groups and mental stamina to be successful. Much like athletes rely on diversified training in investing, we rely on asset diversification, good investor behavior, and consistent saving over time to reach our finish line. We are here to help ensure your investments are helping you reach the finish line no matter what the market environment looks like. Don't ever hesitate to reach out with any questions you may have.

Angela Palacios, CFP®, AIF®, is a partner and Director of Investments at Center for Financial Planning, Inc.® She chairs The Center Investment Committee and pens a quarterly Investment Commentary.

Nicholas Boguth, CFA®, CFP® is a Senior Portfolio Manager and Associate Financial Planner at Center for Financial Planning, Inc.® He performs investment research and assists with the management of client portfolios.

Any opinions are those of the Angela Palacios, CFP®, AIF® and Nick Boguth, CFA®, CFP® and not necessarily those of Raymond James. The information contained in this report does not purport to be a complete description of the securities, markets, or developments referred to in this material. There is no assurance any of the trends mentioned will continue or forecasts will occur. The information has been obtained from sources considered to be reliable, but Raymond James does not guarantee that the foregoing material is accurate or complete. Any information is not a complete summary or statement of all available data necessary for making an investment decision and does not constitute a recommendation. Investing involves risk and you may incur a profit or loss regardless of strategy selected. The S&P 500 is an unmanaged index of 500 widely held stocks that is generally considered representative of the U.S. stock market. The MSCI EAFE (Europe, Australasia, and Far East) is a free float-adjusted market capitalization index that is designed to measure developed market equity performance, excluding the United States & Canada. The EAFE consists of the country indices of 22 developed nations. The Bloomberg Barclays US Aggregate Bond Index is a broad-based flagship benchmark that measures the investment grade, US dollar-denominated, fixed-rate taxable bond market. Keep in mind that individuals cannot invest directly in any index, and index performance does not include transaction costs or other fees, which will affect actual investment performance. Individual investor's results will vary. Past performance does not guarantee future results. Diversification and asset allocation do not ensure a profit or protect against a loss. Investing involves risk and you may incur a profit or loss regardless of strategy selected. Past performance is not a guarantee or a predictor of future results. Raymond James and its advisors do not offer tax or legal advice. You should discuss any tax or legal matters with the appropriate professional.

Share

Q1 2024 Investment Commentary

Print Friendly and PDF

As the 4-year anniversary of the Covid stock market correction came and went last month, markets have given historians and economists much to reflect on. Since the consumer is the major driver of the U.S. economy, the aftereffects of the COVID-19 pandemic stay-at-home policies and the economic reopening policies meant it has taken several years for a recession to roll through the economy. This uncorrelation of the sector effects has made this business cycle feel quite different. For example, when staying at home, we shifted our spending to either saving money or spending on goods rather than services, causing a major recession and unemployment in the services industry (remember when we couldn’t travel and instead spent our money on things like a Peloton!). Once herd immunity was achieved, we shifted our spending patterns from goods to services and travel, causing recessionary characteristics to roll through the manufacturing industry. This lack of synchronization has caused the NBER (National Bureau of Economic Research) to not call a recession here in the U.S. even though we met the official definition of one back in 2022 of two negative quarters of GDP growth (Gross Domestic Product).

Recently, the manufacturing numbers, as measured by the ISM index (a leading economic indicator), finally climbed out of recessionary territory (below 50 readings) after a 16-month continuous streak of contractions. This is the longest contractionary steak since 2002! If you couple this with a recovery in new home building permits (another leading indicator), it looks more and more likely that the Federal Reserve has been successful in engineering a soft landing. The Conference Board Leading Economic Index also rose in March for the first time in two years!

The stock market agrees as the year has started out very strongly, with U.S. stocks up over 10.5% as measured by the S&P 500, U.S. small company stocks up 5.2% as measured by the Russell 2000, and International stocks up 5.78% as measured by the MSCI EAFE. Bonds were off to a slower start, down .78%, as the market reset expectations of the number of interest rate hikes that are likely to occur this year.

As the S&P 500 hits new highs, it is natural that you might be wondering if the market is too expensive. Investing at all-time highs seems like the wrong time to add to your investments. Check out my recent blog for some interesting statistics on forward returns when investing on days the market is making a new high. The moral of the story, though, is that while valuations are expensive, they do NOT necessarily mean the market will crash tomorrow, next quarter, or even next year. Current valuations are usually a poor indicator of how markets will perform in the short run. It is important to set reasonable expectations of future market returns. This is not the same market we have seen over the past couple of years driven by a few concentrated names. Returns have broadened across the benchmark, and political headlines may start to creep into market performance in the short term.

Investing by Political Party: A Long-Term Perspective

What if you ONLY invest in the stock market when your president is in office? Over the past 80 years, the political party-agnostic investor beats the democrat and republican by ~3,000% and ~17,500%!

OK, this may fall under the “lying with statistics” category, but I think it still illustrates two very important points. Stocks don’t grow because of political parties, and time in the market is the single most important factor in growing your investment. 

Let’s consider three hypothetical investment strategies starting with $10,000 in 1945:

  1. Republican Only Investor: puts 100% of their money into the S&P 500 when the president is a Republican, otherwise hides their money under their mattress.

  2. Democrat Only Investor: puts 100% of their money into the S&P 500 when the president is a Democrat, otherwise hides their money under their mattress. 

  3. Agnostic Investor: puts 100% of their money into the S&P 500 the entire time.

The results may shock you. The “Republican Only” investor ends up with ~$309k, the “Democrat Only” investor ends up with ~$1.75M, and the “Party-Agnostic” investor ends up with a whopping ~$54.5M.

Obviously, this hypothetical is a bit outlandish for a few reasons. It has an 80-year time horizon, which is much longer than most people are seriously investing. It is an all-or-nothing strategy that puts all its eggs in one basket or the other. One of those baskets earns 0% (which isn’t realistic if you compare it to money markets or short-term treasuries over time). And lastly, it might lead one to confuse correlation and causation when looking at the Democratic/Republican gap.

It would be easy to point to this as confirmation that the Democratic party is better for stocks, but digging a little deeper makes it less clear. The lead changes throughout history – if we wrote this in the 1990s, someone could point to it as confirmation for the Republican party and stock performance. Aside from that, the gap comes from two very distinct decades: the 2000s that gave investors one of the worst decades of stock returns in history, and the 2010s that gave investors one of the best. Lively debates are still happening today over what caused the Tech Bubble, the Great Financial Crisis, and subsequent recovery – but there were certainly more factors than one. In the long run, stocks grow because earnings grow, and earnings have much more to do with innovation and economic growth than those sitting in the Oval Office.

The second and even more important point is that the best way to partake in those growing stock earnings is, unsurprisingly, to invest in stocks! The chart below uses the same data as the previous chart but only shows the time each investor invested in stocks. Each party held office for almost exactly half of the time, so missing out on the other half was a HUGE detriment to results for both investors.

The Fed, Interest Rates, and Bond Returns

The Fed ended the fastest rate hike cycle in history last summer when they made the final hike to 5.25-5.5%. Since then, the bond market has been trying to pinpoint exactly when the first interest rate CUT would come. March? June? Later? Expectations have been shifting later than initially predicted. You can see that in the rising interest rates the past few months – the 1-year treasury rate was around 4.7% in January but back to 5% by the end of the quarter. What does all this ACTUALLY mean for bond investors, though?

Well, the Fed doesn’t control the entire yield curve – they only have a direct impact on the shortest durations of bonds at the front end of the curve. If you are invested in those short duration bonds, you will probably see the yields fall as the Fed cuts, but the prices of short duration bonds do not move nearly as much as longer duration bonds. Money market funds, for example, have become very popular over the past two years as rates have increased. Roughly speaking, if the Fed cuts rates from 5.5% to 4.5% over the next year, a money market investor would likely see their yield fall a similar 1% but wouldn’t see any price appreciation (they also wouldn’t likely see any price DEPRECIATION if yields were to rise).

Intermediate and long-term bond investors have more factors to consider because those durations are much more volatile and move with longer term economic growth expectations as well as inflation expectations. Just because the Fed cuts rates does not necessarily mean that the 10-year rate would also decrease. BUT if it did, that investor would see significant price appreciation. The flip side to that, as we all saw in 2022, is that those investors saw significant price depreciation as rates rose.

So, What May Be Coming This Quarter?

  • Presidential Primary races will continue throughout this quarter, concluding in early June, but with all opponents dropping out of the race, it looks like we will repeat the 2020 election of Donald Trump and Joe Biden. Market driving election headlines are likely to be minimal for now but may start to play into market performance in the short term. Holding the cash you may need in the next year, lengthening the duration of our bonds – to potentially offset equity market volatility, and rebalancing are all tools we are deploying to take advantage of or insulate against short-term market volatility.

  • Next month, the SEC will shorten the standard trade settlement cycle from two business days to one business day after the trade date. This reduces the time between when a sale of a security occurs and when the proceeds are cleared for withdrawal.  

  • Portfolio spring cleaning? Much like moving through the rooms in your house with a critical eye, the investment committee is focused on reviewing asset classes within the portfolio. We are focused on extending the duration of our bond portfolio with a partial change having already occurred. We will also be doing a deep dive into our international investments. 

We are grateful for the opportunity to guide you throughout your investment journey. If you ever have any questions, don’t hesitate to contact us!

Angela Palacios, CFP®, AIF®, is a partner and Director of Investments at Center for Financial Planning, Inc.® She chairs The Center Investment Committee and pens a quarterly Investment Commentary.

Nicholas Boguth, CFA®, CFP® is a Senior Portfolio Manager and Associate Financial Planner at Center for Financial Planning, Inc.® He performs investment research and assists with the management of client portfolios.

The Composite Index of Leading Indicators, otherwise known as the Leading Economic Index (LEI), is an index published monthly by The Conference Board. It is used to predict the direction of global economic movements in future months. The index is composed of 10 economic components whose changes tend to precede changes in the overall economy.

Any opinions are those of the Angela Palacios, CFP®, AIF® and Nicholas Boguth, CFA®, CFP® and not necessarily those of Raymond James. The information contained in this report does not purport to be a complete description of the securities, markets, or developments referred to in this material. There is no assurance any of the trends mentioned will continue or forecasts will occur. The information has been obtained from sources considered to be reliable, but Raymond James does not guarantee that the foregoing material is accurate or complete. Any information is not a complete summary or statement of all available data necessary for making an investment decision and does not constitute a recommendation. Investing involves risk and you may incur a profit or loss regardless of strategy selected. The S&P 500 is an unmanaged index of 500 widely held stocks that is generally considered representative of the U.S. stock market. The MSCI EAFE (Europe, Australasia, and Far East) is a free float-adjusted market capitalization index that is designed to measure developed market equity performance, excluding the United States & Canada. The EAFE consists of the country indices of 22 developed nations. The Bloomberg Barclays US Aggregate Bond Index is a broad-based flagship benchmark that measures the investment grade, US dollar-denominated, fixed-rate taxable bond market. Keep in mind that individuals cannot invest directly in any index, and index performance does not include transaction costs or other fees, which will affect actual investment performance. Individual investor's results will vary. Past performance does not guarantee future results. Diversification and asset allocation do not ensure a profit or protect against a loss. Investing involves risk and you may incur a profit or loss regardless of strategy selected. Past performance is not a guarantee or a predictor of future results. Raymond James and its advisors do not offer tax or legal advice. You should discuss any tax or legal matters with the appropriate professional.

Share

Tax Diversification and Investment Diversification: The Limitations of Asset Location

The Center Contributed by: Center Investment Department

Print Friendly and PDF

Taxes throughout your lifetime are nearly impossible to predict, so tax diversification is almost as important as the decision to save itself. Taxes are the biggest enemy to retirement and one of your single most significant costs. Therefore, when you are establishing your career, your younger years are the most impactful time to start saving, as shown by the chart below. In this hypothetical example, an investor starting young (Consistent Chloe) has the potential to accumulate far more – teal colored line and ending portfolio value - than a person who waits until age 35 (Late Lyla) – purple colored line and ending portfolio value - to start saving.

Our younger years also offer us a unique opportunity to save in a Roth IRA (tax-free savings) account; however, this is when we are least likely to think of expanding our retirement income options. What if that growth you see in the example above happened all in a tax-free account? This can help you dodge the bullet of taxes later in life.

As we mature in our careers, our income (and tax brackets) naturally increase, and it often becomes more important to invest within tax-deferred accounts. In turn, this gets us tax deductions today that were not always important before.

In our later stages of saving, perhaps when considering early retirement or before social security and Medicare kick in, we would need to start saving into our taxable account buckets to have money readily available for current expenses. This would bridge the gap if accessing our tax-deferred buckets (usually the largest portion of our assets) come with too many strings attached, such as early withdrawal penalties.

So, we know it is important to save and diversify our tax buckets for savings, but are there differences in how we should diversify those asset buckets?

We have all heard that asset location can also be an important tool for diversification. This means placing portions of our investments in certain accounts because of the additional tax benefits that it provides. For example, placing taxable bonds in your tax-deferred accounts to shelter the ordinary income they spin-off or focusing on equities for high growth in our Roth accounts. This makes a lot of sense for someone in the accumulation stage; however, there needs to be even more careful thought applied for someone in or nearing retirement.

There is also such thing as too much of a good thing. Going to extremes and putting all of your bonds in tax-deferred accounts or all of your most aggressive positions in your Roth accounts can lead to some significant shortcomings. Diversifying your investments by tax buckets is important because it gives you the flexibility in any given year to draw from a certain tax profile based on your current situation and cash flow needs. What if you want capital gains only? Take from taxable investments. Need to remodel your house and take a large withdrawal but doing so could push you into a higher cap gains bracket? Take from your Roth. But what if you need to take from that Roth IRA and the markets have corrected 25% that year? In this case, you might be hesitant to take the money out because you want to give it time to experience the rally back that may be on the horizon. You get the picture of where issues could arise. Asset location is a great tool to mitigate taxes, but always be aware that some diversification may always be appropriate in each tax bucket.

It is important to properly diversify on many different levels, and a financial planner can help you do just that. If you have any questions on this topic or others, don’t hesitate to reach out!

The foregoing information has been obtained from sources considered to be reliable, but we do not guarantee that it is accurate or complete, it is not a statement of all available data necessary for making an investment decision, and it does not constitute a recommendation. Any opinions are those of the author and not necessarily those of Raymond James. While we are familiar with the tax provisions of the issues presented herein, as Financial Advisors of RJFS, we are not qualified to render advice on tax or legal matters. You should discuss tax or legal matters with the appropriate professional. Examples used are for illustrative purposes only.

Share

2021 Fourth Quarter Investment Commentary

The Center Contributed by: Center Investment Department

Print Friendly and PDF

As we close the books on 2021 and move into 2022, we took a few minutes to re-read our thoughts as we started the year. There was a sense of hope that the recovery would continue, jobs would recover, and the world would start to normalize. There was also worry over finalizing the election and concerns of tax rate increases. While it has been a bumpy road, the year has ended better than where we began in some very important aspects like job recovery and dodging the bullet of widely higher taxes. We do have a fresh batch of worries but also optimism looking ahead to 2022.

A diversified benchmark portfolio consisting of 60% stocks (split 40/20 between U.S.-S&P 500 and International-MSCI EAFE) and 40% bonds (Bloomberg Barclays U.S. Aggregate Bond Index) is up just over 12.5% for 2021, with the S&P 500 again leading the way at +28.71%, international stocks (MSCI EAFE) at +11.78%, and U.S. Aggregate Bonds at -1.54%. Please keep in mind indices are not available for direct investment. Any investor who attempts to mimic the performance of an index would incur fees and expenses which would reduce returns.

The good news is, for yet another year, the above hypothetical diversified portfolio would be up well over any targets we may have designed with you toward meeting financial planning goals; which should be an investor’s ultimate long term target.

Should we continue to diversify your portfolio?

Investors everywhere have been left wondering, “Why don’t I just own more U.S. stocks if they are producing such stellar returns this year while everything else (bonds or emerging) has produced very ho hum to negative results?” During these times, it is important to open our history books and remember the “lost decade.” 

We are referring to the 10 year time period throughout the 2000’s when the S&P 500 produced a negative total return. This was a very difficult time period starting with the burst of the dot-com bubble and ending with the financial crisis of 2008. Many felt like there was nowhere to hide during this time period. In reality however, those with a widely diversified portfolio had quite the opposite results. Sure a portion of their portfolio was flat to down but many of the other areas of their portfolio performed quite well over this decade, boosting their overall portfolio returns. The chart below illustrates average annual returns from some of the major Morningstar categories from 2000-2009.  The lost decade only applied to one type of investment one could own.

Chart and data courtesy John Hancock® Investments

The Center has a long history, being founded in 1985, so we have the benefit of guiding clients through many types of return environments. Coming into this lost decade, investors were asking us the very same questions we are hearing now, and the chart above shows us how that ended. While we don’t believe we are on the doorstep of another lost decade, we do feel it is not the time to abandon diversification. So, when you open your statements this year, you may see other well-known strategies that are roughly 60% Stock/40% bond up even less at just below 10% for the year. So, be careful before making any drastic changes to your portfolio. Talk to your financial planner first to determine how this might impact your long term goals!

What about Inflation?

People are saving less and spending more. Prior to the pandemic the savings rate, according to the Bureau of Economic Analysis, was roughly 7.5%, spiked up to almost 34% at the start of the pandemic in April 2020, and is now back down to 7.5%. With that large savings round trip, however, cash in bank accounts is still very high. Roughly $3.3 trillion of extra cash has accumulated in bank accounts by Americans (source: Longview Economics). All of this extra cash has served as fuel for inflation. As of the end of November, inflation readings hit a 40 year high of 6.8%. Food and energy were the main drivers of these readings. As stimulus slows, we should see spending (demand) in both of these areas level off and even decline a bit.

The Federal Reserve is now taking active measures to try to combat inflation. If you look at the history of interest rates, we have been very low for a long time. The Federal Reserve under chairs, Yellen and Powell, started to creep them back upwards as we emerged from the financial crisis. Then the pandemic struck and The Fed took them right back down near zero. Now the forecast is to start increasing rates again.

The last time we saw inflation at the levels we are at now was back in the early 1980’s. At that time, interest rates were quite high to try to bring inflation down. Sometimes we get the question of why increasing interest rates help to combat inflation. We love this question because it brings us back to the basics of economics!

Inflation is a result of too much money chasing too few goods. Right now, we have both scenarios of this equation playing out. Too much money (remember the paragraph above where we reference how much money households are holding?) chasing too few goods caused by supply chain disruptions. The basic recipe for inflation is in place. You also compound this by the base of comparison; inflation was next to nothing in 2020, teetering on the verge of deflation because no one was spending money. This is called demand-pull inflation for you economics nerds out there. There is also cost-push inflation happening and wages rising for lower income households. This also increases the price of goods and services (higher costs pushing prices higher).

So if low interest rates (cheap borrowing) and government stimulus has put money into our hands to spend and cause inflation, higher interest rates (more expensive borrowing) and no more government handouts should start to take money out of our hands for spending and therefore slowing the rate we buy things. With less demand comes lower prices or at least prices that rise at a slower pace. This is a long and slow process though. These moves by the Federal Reserve do not accomplish the task overnight. Higher interest rates take months to years to filter their way into the economy and slow inflation. Other forces may be present to help curb inflation in the new year as well. Our basis of comparison is going to rise steadily throughout 2022 and supply chain disruptions should start to ease.

Stocks are expensive.  Is now a bad time to buy?

Stocks were expensive at the start of last year too, but if you avoided the S&P 500 last year then you missed out on over 28% of returns. Valuations are not everything when it comes to stock returns, and trying to time the market rarely works in investors’ favor. We are not market timers, but we do monitor the yield curve, leading economic indicators, and various commentary resources for determining our outlook for equities and bonds. Right now, our signals are still saying neutral stocks to bonds. Our research has also found that forward market performance is not correlated highly with P/E ratios.

The below chart shows how uncorrelated valuations are as a short term indicator. Sometimes, with this reading as of November 30th, the market has been up 20-40% (gray dots above the orange line in the left hand chart) one year out and sometimes it has been down 20-30% (gray dots below the orange line in the left hand chart).  Five year forward returns were all positive and in most cases positive by more than 5-6%.

International valuations are the opposite story and have been for a long time too, yet they continue to underperform.  We continue to hold them as part of the allocation because of the compelling valuation story and importance of diversification. This chart is interesting because it shows how long you can be wrong making an investment call purely on valuation. The ACWI ex-US looked like a good deal versus the U.S. 10 years ago and we know how that story has ended.

The final thing we would like you to remember if you find yourself asking “is now a bad time to buy?” is that if your portfolio is diversified, then large U.S. stocks will only make up a portion of your portfolio. In a diversified 60/40 portfolio for instance, S&P 500 stocks might only make up ¼ of your total portfolio. The other asset classes should provide different return streams or even buffer the portfolio in the event of a U.S. stock market decline. Stick to your plan, rebalance according to it, and avoid making all-in or all-out decisions that could impair your financial future.

Looking forward to 2022

We should start to see interest rates increase and, therefore, we are favoring shorter duration bonds in portfolios for now. We want to continue to let your bonds be bonds and your stocks be stocks. Bonds continue to be an important portion of your portfolio to serve as a volatility dampener while we leave our equities free to generate returns needed to achieve your financial planning goals.

The CDC is relaxing quarantine guidelines as more and more information becomes known about transmutability of the virus. This should serve to start relaxing supply chain disruptions caused by virus spikes hopefully alleviating the transitory portion of inflation. Part of the reason the U.S. performed so strongly in 2021 was a continuation of the re-opening story. We resisted further economic shutdowns despite new waves of Covid outbreaks. Overseas was a different story as outbreaks brought continued sporadic shutdowns. As immunities build and the virus continues to (hopefully) evolve into weaker strains, we should see less of this supporting stronger rallies with overseas markets.

If you are interested in hearing more about our forward-looking views, join us in February for our Economic and Investment Outlook Event. Stay tuned for details in the upcoming weeks.

Remember, we are here to help you meet your investment goals, so feel free to reach out to the investment team or your planner anytime for support. On behalf of the entire Center Team, we wish you a wonderful 2022.

Any opinions are those of the author and not necessarily those of Raymond James. The information contained in this report does not purport to be a complete description of the securities, markets, or developments referred to in this material. There is no assurance any of the trends mentioned will continue or forecasts will occur. The information has been obtained from sources considered to be reliable, but Raymond James does not guarantee that the foregoing material is accurate or complete. Any information is not a complete summary or statement of all available data necessary for making an investment decision and does not constitute a recommendation. Investing involves risk and you may incur a profit or loss regardless of strategy selected. The S&P 500 is an unmanaged index of 500 widely held stocks that is generally considered representative of the U.S. stock market. The MSCI EAFE (Europe, Australasia, and Far East) is a free float-adjusted market capitalization index that is designed to measure developed market equity performance, excluding the United States & Canada. The EAFE consists of the country indices of 22 developed nations. The Bloomberg Barclays US Aggregate Bond Index is a broad-based flagship benchmark that measures the investment grade, US dollar-denominated, fixed-rate taxable bond market. Keep in mind that individuals cannot invest directly in any index, and index performance does not include transaction costs or other fees, which will affect actual investment performance. Individual investor's results will vary. Past performance does not guarantee future results. Diversification and asset allocation do not ensure a profit or protect against a loss. Dividends are not guaranteed and must be authorized by the company's board of directors. Special Purpose Acquisition Companies may not be suitable for all investors. Investors should be familiar with the unique characteristics, risks and return potential of SPACs, including the risk that the acquisition may not occur or that the customer's investment may decline in value even if the acquisition is completed. Investing involves risk and you may incur a profit or loss regardless of strategy selected. Past performance is not a guarantee or a predictor of future results. Raymond James and its advisors do not offer tax or legal advice. You should discuss any tax or legal matters with the appropriate professional.

Share

Q1 2021 Investment Commentary

The Center Contributed by: Center Investment Department

April 2021 - The Center Investment Team provides market feedback for the first quarter.

Print Friendly and PDF

Rotation. The transformation that turns a figure around a fixed point in mathematics.  So far 2021 has been a story of rotation for markets.  Two of the worst sectors in 2020, energy and financials, have become the best performing sectors so far in 2021.  If you looked at your December 31st statement and made changes based on return only – you would have missed significant gains…an old but good lesson that past performance isn’t necessarily indicative of future returns.

graph-1.JPG

Last year technology benefited the most from the pandemic as people shopped from home, worked from home and looked for entertainment at home.  This year markets have been influenced heavily by the deployment of vaccinations and the hope that we can return to normal soon.

asxascsa.jpg

Google trends show increased interest in searches for flights and hotels which is an early sign of pent-up demand for travel that will follow in coming months.

Year to date, through 4/1/2021, a diversified portfolio made up of 40% S&P 500 Index, 20% MSCI EAFE Index and 40% Barclays US Aggregate Bond index is up about 2.4% showing a nice start to the year.  The Federal Reserve has reiterated they are “not even thinking about raising interest rates” according to Chair Jerome Powell.  Despite that, the market has pushed long-term rates higher, pricing in several rate increases before the end of 2023 despite the Fed chair’s messaging.  This has created a challenging return environment to longer dated bonds but results in more attractive interest rates today than we have witnessed in a while.

Economy

Inflation remains muted although we are seeing small pockets due to supply chain disruptions.  Between bottlenecks on the west coast and the blockage of the Suez Canal, it takes goods longer and longer to reach our shores.  A lack of velocity of money continues to be a headwind to higher inflation and the main reason why we haven’t seen it pick up substantially even though the supply of money has grown drastically with monetary and fiscal stimulus. As long as banks don’t have a large incentive to loan money (via higher interest rates) inflation may continue to be muted. 

Initial jobless claims, an early indicator for the direction of unemployment, have dropped to the lowest level recently since the pandemic began.  This should support a continued decline in the unemployment rate.

Government and Stimulus

The American Rescue Plan Act of 2021 was signed in law this past quarter.  This resulted in stimulus checks to the public.  Check out our recent blog for more details. These checks are anticipated to be spent rather than saved.  Check out the graph below showing the spending spike in January after the $600 check was received.  The additional $1,400 checks started getting delivered the week of March 17th.  I expect we will see another spike in consumer spending for March and April.

graph-3.jpg

President Biden hasn’t wasted any time turning attention to the next stimulus plan in the form of the infrastructure bill.  It is likely this bill will not get passed unless mostly “paid for” by other means than deficit financing.  Bargaining on tax hikes has already started in Washington, at least behind the scenes.  It’s going to be a long process, but we can say with high conviction that taxes will likely increase at the corporate and individual levels.  We continue to watch how this will affect markets and you, our clients.  

Impact of Tax Reform on the Stock Market

In wait of details around the Biden administration’s tax reform, which is speculated to increase the corporate tax rate from 21% to 28% and increase GILTI tax rate (foreign tax rate) from 11% to 21%, many are pondering the implications of change on the stock market.  Portfolio strategists believe growth stocks will be most impacted by tax reform.  Some economists estimate that a 28% tax rate could decrease corporate earnings by 9% in 2022.  However, we have to do a bit of perspective-taking before jumping to conclusions about what this means for investors.

1)   Tax reform must go through Congress.  Economists don’t believe a 28% tax rate will pass through congress.  In fact, Goldman Sachs and UBS Financial Services assume a 25% tax rate will pass.  Goldman believes that may look more like a 3% corporate earnings clip, while UBS believes it may be 4%.  Either way, that is much more modest than the 9% some are considering with a 28% tax rate. 

2)   Keep in mind, many forecasters are tempering market expectations already for S&P 500 company profits in 2022.  If the tax hike is less than expected or delayed from the expected timeline there could still be a catalyst for robust market returns in 2022 even with corporate tax rate increases.

3)   Tax reform may not thwart economic growth.  Based on what Biden has proposed in the past, some of the proceeds of tax increases will probably go towards infrastructure spending.  Note: that could help balance the impact of increased tax rates because infrastructure spending usually expands the economy.

4)   Investors are agile.  If growth positions are suspected to be impacted most by tax reform, investors can adjust their strategies to include companies best equipped to handle tax changes.  Not to mention, some companies may even issue special dividends during this time.  When Barack Obama was re-elected in 2012, companies suspected tax hikes (which never came to fruition).  Subsequently, 20 of them issued special dividends. All that to say, there may be some opportunity for investors to pick up investment income.

5)   The last and most important thing to understand when considering the implications of tax reform on the stock market is that historically, there isn’t much correlation between stock market returns and tax reform.  As demonstrated by the chart below, the S&P 500 has been up when taxes both increase and decrease.  Clearly, there is opportunity to meet investment goals no matter the tax policy, so investors should not stray from investment discipline.

graph-4.jpg

Other Headlines: SPACs

More SPACs (Special Purpose Acquisition Company) were created last year than the previous TEN years, and interest in these “blank-check companies” continued to climb in the first quarter of this year. In fact, more money has already been raised in one quarter this year than all of last year’s record year. Here’s a quick look at what they are and why they are taking off. 

graph-5.jpg

First, what is a SPAC? It is a public shell company that raises money to buy a private company. The basic steps look like this:

  1. Manager creates a SPAC

  2. Investor puts $10 into it

  3. Manager buys part of a private company for $10

  4. The private company merges with my public SPAC, and boom – you own $10 worth of a company that is now public (OR you think I picked a bad company, and you take your $10 back).

On the surface it seems like a sweet deal; you either get a piece of a hot new company, or you take your $10 back. There are some unique risks to SPACs, though. The big one is obviously that after the merger you are typically left with a small, unproven company. Smaller, private companies are typically quite risky. The company’s stock price might not go up after it becomes public. It might even fall 50, 60, 70%. Ouch! Also, if you don’t like the deal after it is announced, you just missed out on whatever returns you would’ve had elsewhere. Last year, the S&P 500 returned almost 18% (almost 70% from the market bottom on March 23rd)...many investors sat in a SPAC all year only to reject the deal and missed out on huge potential gains.

There’s no definitive reason why SPACs are taking off, but it does show that there are investors willing to take on a high-risk investment. Maybe there is excess cash in the markets, investor exuberance, something to do with low-interest rates, high valuations or low return expectations elsewhere, or confidence in big name SPAC managers; but whatever it is, it has been a lucrative undertaking for those creating the SPACs as the costs paid to the managers/sponsors are not cheap.

Portal Updates

Just a reminder that we have a Center for Financial Planning Inc. app available in the app store for your investment portal!  If you don’t have access to the portal yet, please reach out and we can set this up for you!  Also, we now have the capability to allow you to aggregate your other accounts in this portal for a complete view of you assets in one place!  If you want to learn more, check out our tutorial videos here.

As always, if you have questions please don’t hesitate to reach out to us!  Thank you for the continued trust you place in The Center!

Any opinions are those of the author and not necessarily those of Raymond James. The information contained in this report does not purport to be a complete description of the securities, markets, or developments referred to in this material. There is no assurance any of the trends mentioned will continue or forecasts will occur. The information has been obtained from sources considered to be reliable, but Raymond James does not guarantee that the foregoing material is accurate or complete. Any information is not a complete summary or statement of all available data necessary for making an investment decision and does not constitute a recommendation. Investing involves risk and you may incur a profit or loss regardless of strategy selected. The S&P 500 is an unmanaged index of 500 widely held stocks that is generally considered representative of the U.S. stock market. The MSCI EAFE (Europe, Australasia, and Far East) is a free float-adjusted market capitalization index that is designed to measure developed market equity performance, excluding the United States & Canada. The EAFE consists of the country indices of 22 developed nations. The Bloomberg Barclays US Aggregate Bond Index is a broad-based flagship benchmark that measures the investment grade, US dollar-denominated, fixed-rate taxable bond market. Keep in mind that individuals cannot invest directly in any index, and index performance does not include transaction costs or other fees, which will affect actual investment performance. Individual investor's results will vary. Past performance does not guarantee future results. Diversification and asset allocation do not ensure a profit or protect against a loss. Dividends are not guaranteed and must be authorized by the company's board of directors. Special Purpose Acquisition Companies may not be suitable for all investors. Investors should be familiar with the unique characteristics, risks and return potential of SPACs, including the risk that the acquisition may not occur or that the customer's investment may decline in value even if the acquisition is completed. Investing involves risk and you may incur a profit or loss regardless of strategy selected. Past performance is not a guarantee or a predictor of future results. Raymond James and its advisors do not offer tax or legal advice. You should discuss any tax or legal matters with the appropriate professional.

Share

Q4 2020 Investment Commentary

The Center Contributed by: Center Investment Department

Center for Financial Planning, Inc. Retirement Planning
Print Friendly and PDF

Closing the books on an eventful 2020

I think we can all agree that 2020 has been unlike anything we have experienced before! If 2020 had a spokesperson, it would be Mayhem from the Allstate commercials. From disturbing scenes of social unrest and racism to a major pandemic, crazy devastating wildfires and an ongoing trade war, not to mention, murder hornets and a very eventful election there have been many reasons why this year has been astounding!

The pandemic has been truly heartbreaking for the average American and the economy, despite this, the S&P 500 ended 2020 with fantastic returns of nearly 18.5%. Again, we are experiencing a large disparity in returns between technology companies and “value” stocks as represented by the Russell 1000 value index, up only 2.8% for the year in stark contrast. Check out the below chart showing the returns of the various S&P 500 sectors for 2020.


VIDEO: If you’d like to see our friendly faces...click to watch our commentary!


Center for Financial Planning, Inc. Retirement Planning

During the last quarter of the year, Emerging Markets and Small company stocks staged a large comeback as investors’ risk appetite increased.

Center for Financial Planning, Inc. Retirement Planning

However, whatever party equity markets were having, the economy was not invited!

Economic Update

Efforts to resume business amid the pandemic were rewarded during the latter half of 2020. Reeling back from a historical low of -31.4% during the second quarter, real GDP was 33.4% in the third quarter of 2020. That is a substantial comeback, but still around 3.5% shy of where it was during the fourth quarter of 2019. In other words, GDP is headed in the right direction, but we still have some catch-up work to do for full economic recovery. October readings support positive momentum for 4Q20 numbers. However, the surging cases of coronavirus infections over the holiday season may reflect slower growth at the end of the quarter and into 1Q21.

Center for Financial Planning, Inc. Retirement Planning

While it's easy to confuse positive stock market returns with economic growth, they are quite different. We can see this in the context of employment. Thirty-four percent of the S&P 500’s growth in 2020 can be attributed to technology, yet the technology sector only represents 2% of the US labor market. On the other hand, government, agriculture and other services, which is almost 40% of the labor market, is not even represented in the S&P 500. Concisely put, US stock strength doesn’t necessarily represent strength in the economy.

Digging into unemployment numbers, the unemployment rate decreased slightly to 6.7% in November. Nonfarm payrolls increased by 245,000 during the same month. Note, this is the weakest pace of payroll increases since the start of the recovery, which reflects a larger challenge. While 56% of the jobs lost between February and April have come back, only about 7% of that comeback has happened since September. We’re witnessing how hard it has been to have business and job growth while maintaining measures created to prevent the spread of covid-19. Both are important, so future job growth is dependent on how we negotiate the two moving forward.

Finally, let’s talk about inflation. Headline CPI and core CPI rose 0.2% month on month in November. Year on year, headline CPI was 1.2% and core CPI was 1.6%. Headline and core personal consumption expenditures (PCE) were generally flat, at 1.1% and 1.4% year on year, respectively. Due to low energy prices and economic slack, inflation ended lower in 2020 than in 2019. However, 2021 may be a different story. With a vaccine-facilitated boost to economic activity, prices hit hardest by the pandemic (think sporting events, dining, concerts, hotel rates, airfare, rent) could strengthen. We’ll likely see depressed prices start to go up. Many suspect the Federal Reserve will recognize this inflation is based on temporary factors, and will not raise interest rates to compress it. We are keeping an eye on how things play out. Overall, 2021 could foster a low and rising inflation environment.

Other investment headlines: Tesla & Bitcoin

You may have noticed two headlines gaining a lot of attention in the 4th quarter from two of the most volatile investments seen in 2020: Tesla and Bitcoin. Tesla finally recorded its fourth consecutive profitable quarter in a row which prompted its entry into the S&P 500. This means that if you own any fund that tracks the index, you now own a piece of TSLA! Albeit a small piece, as it makes up about 1.5% of the index.

Bitcoin was also back making headlines as it broke past its previous high from late 2017 and rose above $28k per BTC by the end of the year. Is the digital currency a speculative asset with no value or the world currency of the future? That is yet to be decided, but as it currently stood at year-end its market cap was ~540B – about the same market cap as Berkshire Hathaway.

COVID-19

The COVID-19 pandemic took a turn for the worse during the 4th quarter of 2020. Cases, hospitalizations, and deaths all continued to climb, but December brought us a glimmer of hope as the FDA expedited the approval process for two vaccines to be distributed across the country. Governor Whitmer gave guidance for the prioritization in Michigan, and the first phase began in December with health care workers who have direct exposure to the virus receiving round 1 of the 2-round vaccine. All essential frontline workers will follow, starting first with those aged 75 and older, then ages 65-74 and adults ages 16-64 with underlying medical conditions, finishing up with the rest of adults aged 16 and over. Click here for more details. We hope that these vaccines are a light at the end of the tunnel, and wish you all health and happiness going into the New Year.

Government Update

The $900 billion fiscal stimulus act continued to face headwinds in the final hour as President Trump changed his stance on the support to families. He called for an increase to the prior negotiated $600 stimulus payments to $2,000. The House narrowly voted in favor of this package and the change, only to be met by resistance in the Republican-led Senate. Voting on this was delayed resulting in $600 stimulus payments getting issued.

The package includes new funding for:

  • Small businesses with an expansion to the PPP program highlights including:

    • Guaranteed funding for first-time applications

    • Second loans with more expansive forgivable uses

    • Easier forgiveness process for loans under $150,000

    • Clarification that businesses can still deduct the (otherwise deductible) expenses of funds paid with this loan

    • Excludes publically traded companies and a business must demonstrate a 25% drop in revenue or more from 2019

  • The second round of individual checks for individuals and families with phase-out starting at $75,000 of income. $600 per adult and child

  • Extension of federal unemployment benefits including an additional $300 per week benefit to unemployed workers until March 14, 2021

  • Moratorium on evictions through January 2021

  • Various funding for state/local programs highlights including

    • $82 Billion to schools and colleges

    • $27 Billion to state highway, transit, rail and airports

    • $22 Billion to state healthcare funding

Restrictions placed on the Federal Reserve

The Federal Reserve (Fed) found itself amid the political battle of the stimulus package. It looks like the Fed may have to discontinue at the end of 2020 and potentially not be able to restart programs under the same terms that were backed by CARES Act funding, including:

  • Primary Market Corporate Credit Facility – loans to investment grade businesses experiencing dislocation due to the pandemic

  • Secondary Market Corporate Credit Facility – the ability for the Fed to purchase investment-grade corporate debt to facilities liquidity in the credit markets

  • Municipal Liquidity Facility – allows the Fed to purchase short term bonds from certain states, counties and cities to ensure access to funds throughout the pandemic

  • Main Street Lending Program – support for small and medium-sized business loans

  • Term Asset-Backed Securities Loan Facility- support for AAA bonds backed by assets such as student/auto/credit card loans backed by the Small Business Administration (SBA)

Fed Chair Powell stated that these lending programs can still be restarted using Treasury’s Exchange Stabilization Fund but the effort to restrict this particular aspect of the Fed’s lending authority can be viewed as Congress stepping in and exerting oversight powers to limit how far the Fed can go in support of critical market functions. We will be watching the evolution of this debate and if the Fed’s communications become more restrained as a result. In the future, we may not be able to expect the Federal Reserve to step in and start buying secondary market issues to support prices.

The new Biden Administration

The run-off election held on January 5th in Georgia determined who holds the Senate. Democrats needed to win both of the Senate seats in Georgia to split the Senate 50-50. This meant that the democrat Vice President would be the tie-breaking vote giving a slight edge to the Democrats. This was the last major hurdle in understanding the makeup of the government for the next couple of years. This democratic advantage paves the way for a more ambitious President Biden legislative agenda. See our post-election update webinar for a summary of potential agenda items for the Biden administration. A shortlist includes President-Elect Biden’s proposed tax increases on corporations, income for those in the highest tax bracket, capital gains and estate taxes, aggressive health care changes, and the Green New Deal. While markets and the economy may favor party splits between the Presidency and Congress, an all-Democratic situation has still yielded positive outcomes for markets. The below chart shows that 27% of the time the Democrats have been in control and GDP growth has been at its best during these times and returns have been good as well.

Center for Financial Planning, Inc. Retirement Planning

In the short term, we could see some near-term weakness in market reaction but President Biden has announced that we can expect a third wave of stimulus payments of $2,000 (or at least the additional $1,400 they were hoping for in the second round) so this could outweigh the risks of market downside in the near term. This still requires a 60 vote in the Senate to pass and may take until March to do so.

There could be some potential impacts to investors that we will be watching closely. Most notable are:

  • Corporate tax rate increases and a minimum tax for corporations seems to be the biggest potential impact to markets under a Democratic sweep

  • Changes to capital gains tax rates and the preferential tax rate on qualified dividends (although could be limited to those with incomes over $1 Million) could affect individual investor behavior

It’s important to remember that many factors impact markets with politics making up a small portion of those factors!

Hopefully in 2021 Mayhem sticks with the commercials but regardless of what happens, we are here as your partners to get you through whatever is thrown our way and help you achieve your financial goals. Thank you for the trust you place in us.


Sector Returns: Sectors are based on the GICX methodology. Return data are calculated by FactSet using constituents and weights as provided by Standard & Poor’s. Returns are cumulative total return for stated period, including reinvestment of dividends. The foregoing information has been obtained from sources considered to be reliable, but we do not guarantee that it is accurate or complete, it is not a statement of all available data necessary for making an investment decision, and it does not constitute a recommendation. Any opinions are those of the author, and not necessarily those of Raymond James. Investing involves risk and you may incur a profit or loss regardless of strategy selected, including diversification and asset allocation. Bitcoin issuers are not registered with the SEC, and the bitcoin marketplace is currently unregulated. The prominent underlying risk of using bitcoin as a medium of exchange is that it is not authorized or regulated by any central bank. Bitcoin and other cryptocurrencies are a very speculative investment and involves a high degree of risk. Investors must have the financial ability, sophistication/experience and willingness to bear the risks of an investment, and a potential total loss of their investment. Securities that have been classified as Bitcoin-related cannot be purchased or deposited in Raymond James client accounts. Prior to making an investment decision, please consult with your financial advisor about your individual situation.

Share

How To Invest In A Bear Market

The Center Contributed by: Center Investment Department

How to invest in a bear market? Center for Financial Planning, Inc.®
Print Friendly and PDF

In a Q+A, our Director of Investments Angela Palacios, CFP®, AIF® provides valuable advice on the dos and don’ts of investing in a bear market. A “bear market” is when assets fall at least 20% or more from their high. We are currently facing a bear market.

What is a bear market and what triggers them? 

A variety of situations can cause a bear market. They can be event-driven, which explains the current bear market. A black swan event like COVID-19 or a shock in commodity prices like the price war on oil can cause bear markets that lead to recessions. In the case of late 2018, that brief bear market was driven by the trade-war escalation. This example did not lead to a recession. Financial imbalances like high inflation, increasing interest rates from the Federal Reserve, or banks being too leveraged (like in 2008) are all issues that can trigger a bear market and lead to an eventual recession.   

What's good/bad about investing in a bear market? 

Data from historical bear markets indicate that they are excellent investment opportunities, however, it is the most difficult time to invest. Bear markets allow us to tax-loss harvest to offset future capital gains, ultimately reducing our tax bills. We can rebalance out of positions that may not be our highest conviction investing ideas that we have had to hold on to due to high capital gains embedded in those positions.

What investments are best for a bear market and why?

We believe “Core Fixed Income” is often the best strategy to offset the downside risk from equities. These include positions like U.S. Treasuries and High-Quality Corporate debt. Generally, when equities are going down, investors are buying these types of investments. Cash is also a good insulator during times like this. Even though interest rates are low, there is no substitute for its safety. It is very important to always have your next 6-18 months of cash needs set aside so you don’t have to liquidate during times of market turmoil.

What should a brand new investor know about building a portfolio in a bear market? Is it a good time for newbies to enter the market while prices are down? 

Start building a portfolio regardless of whether we are in a bull market or a bear market. The old saying goes, “Time in the market is more important than timing the market”. Most investors save systematically throughout their lives rather than investing in one lump sum. We save every month through our 401(k) deferrals or every year when we get that bonus from work. Dollars go farther in bear markets because the shares of the mutual fund you are buying are now on sale. Investing is the only time in life when buying something on sale doesn’t feel good, but it should if you have a long time horizon to save.

What advice do you have for managing a portfolio in a bear market and when it begins to turn bullish again? For example, how do you manage risk and asset allocation to stay on target with your goals? 

The investing strategy and financial planning goals should be developed during quieter times. Thinking ahead to how you should react during times like this is crucial because in the moment our emotions are very difficult to overcome. A rebalancing strategy also needs to be developed at the same time you are developing your investment strategy. It is a concept that sounds simple but can be very easy to neglect. When markets are doing great and there is very low volatility (like January of this year), you may be tempted to let your best-performing investments run just a little bit longer before rebalancing…meaning you hold your stock positions rather than rebalancing into bonds. In other years that may have been fine, but this year it was not. So, having thresholds around how much stock and bonds you have in your portfolio can take the guesswork out of when to rebalance. That is extremely important at the depths of a bear market because one of the best ways to help your returns coming out of a bear market is simply to rebalance back to your target allocation of stocks and bonds. When markets are down, this means selling bonds and buying stocks.

We hope you found this informative. If you have additional questions, please contact your advisor!

This material is being provided for information purposes only. Past performance doesn't guarantee future results. Investing involves risk regardless of the strategy selected, including diversification and asset allocation. Rebalancing a non-retirement account could be a taxable event that may increase your tax liability.

Investment risk is real. Here’s how we manage it.

The Center Contributed by: Center Investment Department

Investment risk is real. Here's how we manage it.

Investment risk is real. Every day. Every year. In up and down markets. Even in good times – when, for example, U.S. Equities are performing well – we all can use this friendly reminder:

The management of investment risk is constant in successful investing.

Benjamin Graham, known as the “father of value investing,” dedicated much of his book, The Intelligent Investor, to risk. In one of his many timeless quotes, he states, “The essence of investment management is the management of risks, not the management of returns.” To many investors, this statement may seem counterintuitive. Rather than an alarm, though, risk may serve as a healthy dose of reality in all investment environments.

Our Take on Risk

How do we at The Center attempt to manage risk as we steward approximately $1.1 billion in assets? We:

We have been managing client assets for more than 34 years. We fully understand and appreciate the importance of investment returns. We also know that risk is an important element when constructing portfolios intended to fund some of life’s most important goals, such as sending a child or grandchild to college, funding a long and successful retirement, having sufficient funds for long-term health needs, and passing a legacy to loved ones.

While no one can guarantee future investment returns, our experience suggests that those who follow our risk management tactics may better stay on track with their financial plans. 

If you are a client, we welcome the opportunity to talk more about how your portfolio is constructed. Not a client? We’d enjoy the opportunity to share our experience and review your goals and risk.


Any opinions are those of Center for Financial Planning, Inc.® and not necessarily those of Raymond James. This material is being provided for information purposes only and is not a complete description, nor is it a recommendation. Investing involves risk and you may incur a profit or a loss regardless of strategy selected. Prior to making an investment decision, please consult with your financial advisor about your individual situation.

Share