Money Centered Blog — Center for Financial Planning, Inc.

A Privately Held Wealth Management Firm for Generations Form CRS Newsletter Signup

Center Investment Department

What Is Tactical Allocation and Why Would I Use It?

The Center Contributed by: Center Investment Department

20190319.jpg

You’re probably familiar with strategic investing, picking the amounts of stocks, bonds, and cash that create the foundation of your portfolio. But you may also want to consider another layer of portfolio management.

Investors who overweight or underweight asset classes as perceived market opportunities arise are implementing a tactical allocation.

Typically, a tactical allocation overlays a strategic allocation to help reduce risk, increase returns, or both.

While we believe that the relationship of valuation between markets over long periods will be efficient and will correspond to fundamentals, we also know that over shorter periods, some markets may become overvalued and other asset classes will become undervalued. It makes sense at those times to use a tactical allocation strategy. When executed correctly, a somewhat modified asset allocation may offer better returns and less risk.[1]

A tactical asset allocation strategy can be either flexible or systematic.

With a flexible approach, an investor modifies his or her portfolio based on valuations of different markets or sectors (i.e. stock vs. bond markets). Systemic strategies are less discretionary and more model-based methods of uncovering market anomalies. Examples include trend following or relative strength models.

With a tactical allocation, keep in mind less can be more. Successful execution of these methods requires knowledge, discipline, and dedication. The Center utilizes tactical asset allocation decisions to supplement our strategic allocation when we identify a compelling opportunity. Our Investment Committee arrives at these decisions based on many factors considered during our monthly meetings.

Want to learn more? Reach out to your financial planner or a member of the Investment Department team to learn how The Center uses tactical allocation to manage your portfolio.


[1] All investing involves risk, and there is no assurance that this or any strategy will be profitable nor protect against loss.

Opinions expressed in the attached article are those of the author and are not necessarily those of Raymond James. Any information is not a complete summary or statement of all available data necessary for making an investment decision and does not constitute a recommendation. Every investor's situation is unique and you should consider your investment goals, risk tolerance and time horizon before making any investment. Prior to

Job Transition and Your Investments

The Center Contributed by: Center Investment Department

We at The Center know that people can be overwhelmed with difficult decisions, especially during stressful life events such as job loss or change.

Job Loss, Job Transition and Your Investments

GM recently announced plant closings and layoffs across the country, which will affect thousands of workers. This hits close to home for those of us in the Motor City and reminds us to look at your investment portfolio, ensure proper allocations, and ask these questions:

Am I close to retirement?

It may be time to scale back your portfolio’s risk. If you are invested within a target date retirement fund, this may already be happening for you.

How long before I have to use this money?

With funds you won't need for more than 5-10 years, you may want to ensure you are taking enough risk to help meet your goals. If you are invested within a target date retirement fund, this may already be happening for you.

What is my ability to take risk?

You may be able to take on more risk if you don't depend entirely on your portfolio. In this case, a target date fund may not be appropriate.

Do I get uneasy or worried when my portfolio drops by a certain percentage and feel the need to take action?

If this affects your decision making, even under normal circumstances, guidance from an advisor during a time of change may help alleviate additional stress.

What Can I do?

Review the investments in your account and your beneficiaries. We often neglect our 401(k) accounts in times of change.

Maintain a diversified portfolio to help stay on track for your retirement goals. Some plans offer an overwhelming number of choices, while other plan offerings seem insufficient to diversify a portfolio. Your advisor can help with your comprehensive investment strategy, especially during challenging times.

When you’ve spread assets among multiple financial institutions, maintaining an effective investment strategy – one that accurately reflects your goals, timing, and risk tolerance – may become difficult. Consolidate, and your financial professional can help ensure these assets are part of an overall allocation strategy that reflects your current financial situation and long-term retirement goals.

For more information on consolidating retirement accounts, read “Simplifying Your Retirement Plans.”


Any opinions are those of the author and not necessarily those of RJFS or Raymond James. The information has been obtained from sources considered to be reliable, but we do not guarantee that the foregoing material is accurate or complete. Expressions of opinion are as of this date and are subject to change without notice.

Every type of investment, including mutual funds, involves risk. Risk refers to the possibility that you will lose money (both principal and any earnings) or fail to make money on an investment. Changing market conditions can create fluctuations in the value of a mutual fund investment. In addition, there are fees and expenses associated with investing in mutual funds that do not usually occur when purchasing individual securities directly.

Bond woes: “Why do we own bonds if we think they aren’t going to do well in a rising rate environment?”

The Center Contributed by: Center Investment Department

Hoping for capital gains is not a good reason why you should own bonds. Actually, owning or  buying bonds in this low and rising interest rate environment with the hope that you'll be able to sell them later at a higher price may not work out. BUT…just because you can’t sell this investment at a profit later does not make the investment a bad idea.

20181113.jpg

A great real life comparison is a car. We own a car to get our family and us from one place to another, hopefully safely. Many components go into the makeup of a safe driving automobile. The engine is key in making the car go. Stocks act much like the engine of a car.  They make our portfolios go/grow. But, would you ever drive a car that wasn’t equipped with brakes or an airbag? Brakes and airbags are similar to the bonds in our portfolio. Bonds help you control some of the risk of owning stock. For most people, the reason to own bonds is to slow down our bottom-line losses experienced in our portfolio during major market declines. Without this moderation (and sometimes even with it), investors tend to panic when stock prices fall.

So in a nutshell, “Why own bonds?”

They make the scary times less so. When the stock market experiences an extended decline, investors look around for where to turn. Cash and Bonds are usually the place they turn to.A volatile stock market can happen suddenly and unexpectedly. Waiting to add bonds until something happens means you are going to suffer much of the downside before you actually add them to the portfolio. You have to have already had them in the portfolio for them to help. Talk with your financial planner to make sure you have the proper amount of your portfolio invested in bonds so you can hang on to your investments through those difficult times. A portfolio makeup that allows you to stay the course over the long term is much more likely to get you to your destination!


https://www.marketwatch.com/story/why-bonds-are-the-most-important-asset-class-2015-06-10 Links are being provided for information purposes only. Raymond James is not affiliated with and does not endorse, authorize or sponsor any of the listed websites or their respective sponsors. Raymond James is not responsible for the content of any website or the collection or use of information regarding any website's users and/or members.

Mid-term Elections and the Market: 2018 Outcome

The Center Contributed by: Center Investment Department

Mid-term Election and the Market: 2018 Outcome

Voting day came and went much as the markets had anticipated.  Democrats flipped the House of Representatives over to their control while the Senate maintained and even strengthened their republican majority.  From a legislative policy perspective, we expect the republican agenda to slow.  Mid-term election implications may include:

  • The President can continue to act alone regarding trade policies but had bi-partisan support for cracking down on China’s trade and intellectual property practices anyway

  • Democrats are going to scrutinize and investigate President Trump, his cabinet officials and executive actions…yes, even more!

  • Any further tax cuts are unlikely

  • Democrats will likely get to work on some infrastructure spending

  • Affordable Care act will be strongly defended

While markets care about legislation and the far-reaching impact those decisions make, long-term markets are agnostic to election results. Information and how markets digest the information affect investment outcomes more than politics.  Frankly, markets do not really care which side is in control.  In fact, the new balance of power sets a similar stage for the strongest historical performance in the S&P 500 for a republican president.  Want to learn more, check out this blog, “Mid-Term Elections and the Market.”


Any opinions are those of the author and not necessarily those of RJFS. The S&P 500 is an unmanaged index of 500 widely held stocks that is generally considered representative of the U.S. stock market. Investing involves risk and investors may incur a profit or a loss. Links are being provided for information purposes only. Raymond James is not affiliated with and does not endorse, authorize or sponsor any of the listed websites or their respective sponsors. Raymond James is not responsible for the content of any website or the collection or use of information regarding any website's users and/or members.

Share

Implementing Your Asset Allocation

The Center Contributed by: Center Investment Department

20180911.jpg

At Center for Financial Planning, Inc.®, one of our core investment beliefs revolves around utilizing a strategic asset allocation. We believe there is an appropriate mix of assets that can help investors meet their goals based on well-established and enduring asset classes. This can vary over time depending on your objectives and evolving markets. Finding the right combination of these asset classes and allocation to each plays a pivotal role in managing risk and aiding in ensuring stabilizing returns. In previous blog posts, we’ve discussed the purpose of asset allocation and how to determine the proper asset allocation.  Now let us wrap up this subject with a hypothetical example of the implementation.

Below is a chart of a financial plan overhaul.  You can see there is quite a difference between the current allocation and a recommended allocation.  The current allocation (in blue) is overweight US Large Cap stocks and International Large Cap stocks while underweight the bond asset categories that we define as Core Fixed Income and Strategic Income.  The financial plan takes into consideration any outside accounts like 401k’s, insurance, and/or annuity products to truly understand an entire investment portfolio and determine a suitable asset mix. This helps keep a client within their volatility comfort range as well as on track to reach their return expectations over the long haul.

Source: Morningstar

Source: Morningstar

The recommendation involves selling some of the positions that fall within the overweight asset classes while adding to the underweight bond asset classes.  The end result should be a portfolio with less risk which can be important leading into those early years of retirement if returns had been excellent in recent years it would be important to have a careful eye toward taxes and work with a CPA to construct a tax efficient strategy to divest some of the risk. 

If you are unsure how your asset allocation stacks up, seek out a financial planner so they can assist you in developing an appropriate strategy tailored to your unique needs.


These asset allocations are presented only as examples and are not intended as investment advice. Actual investor results will vary. Prior to making an investment decision, please consult with your financial advisor about your individual situation. Although derived from information which we believe to be reliable, we cannot guarantee the completeness or accuracy of the information above. Any information is not a complete summary or statement of all available data necessary for making an investment decision and does not constitute a recommendation. Investments mentioned may not be suitable for all investors. Any opinions are those of Angela Palacios and not necessarily those of RJFS or Raymond James. Investing involves risk and asset allocation and diversification does not ensure a profit or protect against a loss. 1. Core Fixed Income includes: U.S. Government bonds and high quality corporates 2. Strategic Income includes: Non U.S. bonds, TIPS, high yield corporates and other bonds not in core fixed. 3. Strategic Equity includes: REITS, hedging strategies, commodities, managed futures etc. Large cap (sometimes "big cap") refers to a company with a market capitalization value of more than $10 billion. Large cap is a shortened version of the term "large market capitalization. Smaller mid caps, which are defined as those that fall below a certain market-cap breakpoint, and "small plus smaller mid caps", which include both companies considered small-cap and the smaller mid-cap companies. Mid caps are typically defined as companies with market caps that are between $2 billion and $10 billion. Mid-cap stocks tend to be riskier than large-cap stocks but less risky than small-cap stocks. Small caps are typically defined as companies with market caps that are less than $2 billion. Many small caps are young companies with significant growth potential. However, the risk of failure is greater with small-cap stocks than with large-cap and mid-cap stocks.

Is there a loss when a municipal bond purchased at a premium matures at par value?

The Center Contributed by: Center Investment Department

20180821.jpg

Investors often erroneously believe that they will lose money when purchasing a bond at a premium and allow it to mature at a lower par value.  In order to understand why this is not the case we should step back and explain some bond basics.

Coupon and Par Value explained

Bonds pay interest to you, the investor. A coupon is simply the amount of money that you receive at each interest payment (typically every six months). Par value, or the issuer’s price of a bond, is typically $1000. If a bond has a 5% coupon, then you receive 5% of $1000 every year; or $25 every 6 months.  The price you pay is often expressed as a percent of par value.  So if it is selling at $103 you are paying 103% of the par value, or $1,030. (1,000*1.03).

Why would you pay a premium?

When you buy a municipal bond at a premium price (or more than the $1,000 par value), you may be doing so because you are getting a higher coupon rate.  For example, let’s say the going market interest rate for a par value bond you are looking at is 3%.  If you found a bond that is paying a coupon of 4% with the same maturity you may think, “Jackpot!”  However, in order to buy this bond you are going to have to pay more than the $1,000 par value for the 3% bond. To better understand this we use the measure of yield to maturity (the rate at which the sum of all future cash flows from the bond is equal to the current price of the bond).  Ultimately, the yield to maturity should be very similar between the two bonds, you will just get more current income from the premium bond as it has a higher coupon, but you pay a higher price to get it.  Unfortunately, you don’t get to write off this “loss” when the bond matures and only pays you back the $1,000 par value.  The premium of this bond is amortized down each year and is being returned to you in the form of the higher coupon rate.  See the example below.

20180821a.jpg

Once the bond finally matures, you have amortized out all of the premium over the life of owning the bond and your cost basis would ultimately be the par value now.  Fortunately, you don’t have to worry about calculating this yourself.  IRS guidelines require your custodian to calculate and report this on your yearly 1099 Form.

The foregoing information has been obtained from sources considered to be reliable, but we do not guarantee that it is accurate or complete, it is not a statement of all available data necessary for making an investment decision, and it does not constitute a recommendation. Any opinions are those of Tim Wyman and not necessarily those of Raymond James. Bond prices and yields are subject to change based upon market conditions and availability. If bonds are sold prior to maturity, you may receive more or less than your initial investment. There is an inverse relationship between interest rate movements and fixed income prices. Generally, when interest rates rise, fixed income prices fall and when interest rates fall, fixed income prices rise. Investments mentioned may not be suitable for all investors. Investing involves risk and investors may incur a profit or a loss. Please include if clients are able to click on the link: Links are being provided for information purposes only. Raymond James is not affiliated with and does not endorse, authorize or sponsor any of the listed websites or their respective sponsors. Raymond James is not responsible for the content of any website or the collection or use of information regarding any website's users and/or members.

How to Rebalance a Portfolio

Contributed by: Center Investment Department The Center

20180605.jpg

An investment strategy that uses asset allocation must rebalance, or realign the weightings of the portfolio assets; the question is not if, but how.  Rebalancing is a type of active portfolio management strategy we employ either to potentially enhance returns, control risk, or both.  There are several ways to rebalance a portfolio: on a calendar basis, using cash flows, and opportunistically.  We utilize a combination of Cash Flow and Opportunistic rebalancing.

Calendar Rebalancing

Calendar rebalancing is done by choosing a specific date (usually arbitrarily such as on a quarterly, semiannual or annual basis) to rebalance portfolios. Studies have shown that there is not much performance differential between the different frequencies of rebalancing.  By utilizing a set calendar date to rebalance, often the best buy-low/sell-high opportunities are missed. 

Cash Flow Rebalancing

In contrast, cash flow rebalancing is prompted when cash is moving into or out of the accounts.  For example, if a cash distribution is needed, the asset category or categories that are the most overweight will be sold to raise cash.  Within the overweight asset category, we will sell the security with the lowest preference first to generate the needed cash.  If cash is flowing into the account, we will purchase the asset category or categories that are the most underweight.  Within the underweight category, we will purchase the security with the highest preference first. Security “preference” is determined opportunistically within our investment committee.

20180605a.jpg

Opportunistic Rebalancing

When an asset allocation is determined after the financial planning and risk assessment, a set of drift ranges are also assigned.  The highest level strategic allocation (i.e., stocks to bonds) is allowed to drift a total of 10% either direction from the overall target.  On a more granular level, each asset category is allowed to drift 20% in either direction.  For example, if the US Large Cap allocation is at 25% of the portfolio, it could drift to as low as 20% or as high as 30% of the portfolio before rebalancing would occur.  The idea behind this is to help your winners continue to grow before you are flagged to rebalance and “sell high”/”buy low”. This can also be referred to as range or threshold rebalancing.  Range rebalancing occurs when at least one asset category is outside of the range bands.  At this point, the out of tolerance band is brought back to target. 

20180605b.jpg

Rebalancing is an important tool for long-term investors to stay on course.  A Financial Planner can help you employ these more sophisticated strategies outlined above!

Daryanani, Gobind CFP®, Ph.D.”Opportunistic Rebalancing: A New Paradigm for Wealth Managers.” 2008.   Journal of Financial Planning.


Rebalancing a non-retirement account could be a taxable event that may increase your tax liability.  Illustrations have been provided for educational purposes only and are not intended as investment advice.  Investing involves risk, investors may incur a profit or loss regardless of the strategy or strategies employed.

The information contained in this blog does not purport to be a complete description of the securities, markets, or developments referred to in this material. The information has been obtained from sources considered to be reliable, but we do not guarantee that the foregoing material is accurate or complete. Any opinions are those of the professional of the Investment Department at The Center and not necessarily those of Raymond James. Every investor's situation is unique and you should consider your investment goals, risk tolerance and time horizon before making any investment. Prior to making an investment decision, please consult with your financial advisor about your individual situation. Future investment performance cannot be guaranteed, investment yields will fluctuate with market conditions.

Share

What are Time-Weighted and Dollar-Weighted Returns?

Contributed by: Center Investment Department The Center

20180508.jpg

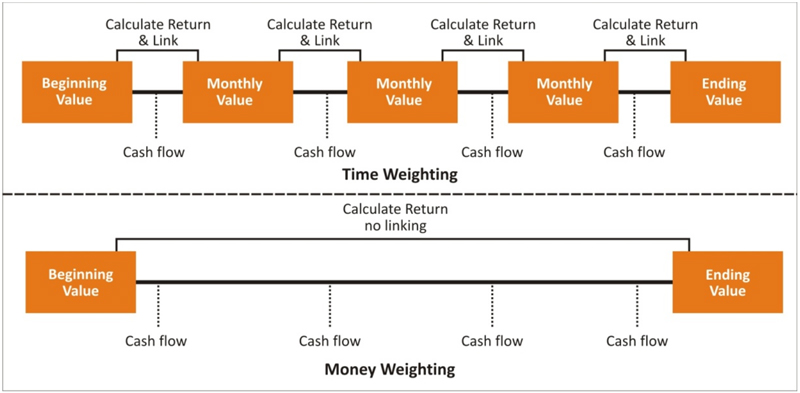
Monitoring investment performance is pretty important.  It can help identify positive or negative investment decisions and help determine whether your investment goals are on track.  For many investors, reading investment performance statements can be very confusing.  Your rate of return on one statement may look different from another.  The truth is that those differences can largely be attributed to the way the rate of return is calculated.  There are two basic performance calculation methods: the time-weighted rate of return (TWRR) and dollar-weighted rate of return (DWRR).

Key Differences

20180508a.jpg

Each method is designed to measure different scenarios.  The time-weighted rate of return calculation method (top of diagram) was originally developed so fund managers could measure the performance of their portfolios independent of an investor’s actions.  It isolates the manager’s specific performance from investor timing of contributions and withdrawals. TWRR depends only on the length of time money has been in the portfolio and not on the size of the investment – hence the term “time-weighted.”  Performance is broken down into smaller pieces when cash flows occur and then linked together so the cash flow itself doesn’t have an impact on the return calculated. This way if an investor were to make a large deposit halfway through the year, the performance of the second half of the year doesn’t hold more weight than the first half. The opposite would be true for withdrawals.

In contrast, the dollar-weighted rate of return calculation method (also referred to as money-weighted return) measures the size and timing of cash flows, in addition to the investment performance of the funds chosen by the investor. Periods in which more money is invested contribute more heavily to the overall return – hence the term “dollar-weighted.”  Investors are rewarded more for larger investments made during periods of greater price appreciation or penalized less for negative returns that occur when a lower amount of money is invested.  The internal rate of return is synonymous with the dollar-weighted rate of return, but the term is typically used in corporate finance to predict the rate of growth a project is expected to generate.  It is the rate of return that equates the present value of costs and benefits of an investment.  You often see internal rate of return calculations used for private equity investments or when determining the viability of investing in a project.

Which Method Should You Monitor?

Dollar-weighted returns can be thought of as investor-centric because they do not isolate the portfolio’s underlying performance from an investor’s luck and timing. This is what is shown on Raymond James statements because it is a more helpful representation of what the investor actually experienced during the time period.

The information contained in this blog does not purport to be a complete description of the securities, markets, or developments referred to in this material. The information has been obtained from sources considered to be reliable, but we do not guarantee that the foregoing material is accurate or complete. Any information is not a complete summary or statement of all available data necessary for making an investment decision and does not constitute a recommendation. Any opinions are those of professionals of the Investment Department at The Center For Financial Planning, Inc. and not necessarily those of Raymond James. There is no guarantee that these statements, opinions or forecasts provided herein will prove to be correct. Investing involves risk and you may incur a profit or loss regardless of strategy selected. Future investment performance cannot be guaranteed, investment yields will fluctuate with market conditions. Every investor's situation is unique and you should consider your investment goals, risk tolerance and time horizon before making any investment. Prior to making an investment decision, please consult with your financial advisor about your individual situation.

Share

Trade War or Negotiation Tactic?

Contributed by: Center Investment Department The Center

20180320.jpg

In March, President Trump announced tariffs for the steel and aluminum industry (25% tariff on steel and 10% tariff on aluminum) outside of the approval from his advisors.  He stated these tariffs are to protect industries in the U.S. and protect national security. Trump’s campaign focused a lot on trade with China and Mexico. This announcement lead to the departure of Gary Cohn who held the top economic advisor position to the President.  Since then, potential exemptions or grace periods for some countries were created softening his initial threat.  These exemptions are designed primarily for Canada and Mexico with whom; by the way, we are in the middle of re-negotiating NAFTA (North American Free Trade Agreement).  This exemption is contingent on a NAFTA deal.  This type of threat is exactly the type of shock and awe we have gotten used to from the President as a bargaining chip.  While the stock market initially had a strong negative reaction as this news came out, it has since recovered.  The market also took in stride the news of Gary Cohn departing and threats from other countries to retaliate with their own tariffs.

20180320a.jpg

Following is some insight from our team into what tariffs are and why we need to pay attention to a potential trade war and how it may affect portfolios.

What are tariffs?

Let’s start from the top – a tariff is a tax placed on imports from another country. The idea is to make goods from other countries more expensive to encourage consumers to purchase domestic goods.

Who wins and who loses?

Winners:

  • + Domestic industries whose competition has been limited

  • + Workers in those domestic industries

  • + The government which collects the revenue from the tariff

Losers:

  • - Foreign exporters whose goods are less attractive to the domestic country

  • - Domestic consumers who see prices rise

  • - Secondary industries who rely on the imported product (in the case of steel think automobiles, heavy duty equipment, etc.)

On what products/countries does the U.S. currently impose tariffs?

The U.S has tariffs in place on thousands of products including animals, food, other commodities, but most tariff revenue in the U.S. comes from apparel and cars (https://www.cnbc.com/2016/12/07/trump-tariffs-countries-and-products-that-pay-the-highest-us-tariffs.html). The countries that pay the most to the U.S. from tariffs are China, Vietnam, and Japan. Canada and Mexico import more than every other country besides China, but do not come close to duties paid compared to the other countries because of current agreements through NAFTA.

China is currently the world’s largest producer of steel, but according to the International Trade Administration (https://www.trade.gov/steel/countries/pdfs/imports-us.pdf), less than 2% of the U.S.’s steel came from China. Mexico and Canada are large exporters of steel to the U.S., but are currently exempt from the tariff, for now, while NAFTA negotiations are underway.

The impact on markets and portfolios

Steel and aluminum market capitalization is less than $50 Billion (or about 1/10 the market cap of Facebook Inc.), so direct implications on stock prices may not be the cause of much worry. The fear comes from the uncertainty of a global trade war. Countries can retaliate and place tariffs of their own on products imported from the U.S., which could disrupt any number of markets.

So what is going to happen? Whenever you restrict the flow of goods and services, you risk causing inflation and a deterioration in global trade. Low and rising inflation is usually good for stock markets, and we are starting from a place of low inflation.  Initially, there could be some market jitters as inflation creeps back up.as we witnessed in early February but those should abate as investors realize that inflation is still quite low.  The deterioration in global trade is what could have a more significant impact on stock and bond markets.  The question of whether or not this is just a bargaining chip for President Trump remains to be seen.  If this is the case, it will likely not be pushed to the point where it starts to meaningfully affect global trade. The last time the U.S. took a similar step to impose tariffs on steel was back in 2002 and retaliatory actions from other countries caused President Bush to halt the practice after only 19 months.  In an economy that has a strong fundamental footing, as the U.S. does now, higher inflation and even interest rates should not be too punitive for stocks.  We recommend maintaining a well diversified portfolio in this environment.  If you have any questions, don’t hesitate to reach out!


The information provided does not purport to be a complete description of the securities, markets, or developments referred to in this material; it has been obtained from sources deemed to be reliable but its accuracy and completeness cannot be guaranteed. Opinions expressed are those of the team of Center for Financial Planning and are not necessarily those of Raymond James. There is no assurance that any forecasts provided will prove to be correct. The S&P 500 is an unmanaged index of 500 widely held stocks that is generally considered representative of the U.S. stock market. Please note, direct investment in any index is not possible. Past performance is not a guarantee of future results. Diverisification does not ensure  a profit or guarantee against loss. Links are being provided for informational purposes only. Raymond James is not affiliated with and does not endorse, authorize or sponsor any of the listed websites or their respective sponsors. Raymond James is not responsible for the content of any website or the collection or use of information regarding any website's users and/or members.

Share

Does Staying the Course Pay Off for your Investment Strategy?

Contributed by: Center Investment Department The Center

20180227.jpg

Almost every year, it seems there is some reason to be concerned with markets.  When market volatility strikes, we often get questions from investors as to whether or not they should sell their portfolio.  Russell Investments does a great job illustrating portfolio performance during the market’s many ups and downs in the chart below.  They look at a hypothetical portfolio of 60% stocks and 40% bonds faced with three alternative investment paths as of Sept. 30, 2008 (two weeks after the collapse of Lehman Brothers).

The starting point for the $100,000 hypothetical portfolio is Oct. 9, 2007, the market peak before the great recession. Over the next year, you would have watched the S&P 500 drop over 20%.  The three choices as of Sept. 30, 2008 are:

  1. Stay invested, and make no changes (orange line).

  2. Move to 100% cash, and remain in cash (light blue line).

  3. Move to 100% treasuries, and remain in treasuries (grey line).

The chart shows the clear winner – stay invested and make no changes. Even though you had to stomach even more downside initially, as well as a menu of other market-altering headlines in the following years, when sticking with a 60/40 diversified portfolio, investors recovered a greater percentage of their lost value— and at a faster rate—than going to cash or treasuries.

20180227a.jpg
20180227b.jpg

Now imagine the potential magnification of the success of the orange line if you were saving regularly during that same time period through a vehicle like your 401(k).  While it may have been difficult to stay the course, 2008 offered a buying opportunity that eventually supported portfolio performance success through 2017.  Planning without panicking is the key.  Make sure you develop a sound savings plan and stick to it regardless of what markets may throw our way!

This information has been obtained from sources deemed to be reliable but its accuracy and completeness cannot be guaranteed. Asset allocations are presented only as examples and are not intended as investment advice. Investing involves risk, investors may incur a profit or loss regardless of the strategy or strategies employed. Future investment performance cannot be guaranteed. The S&P 500 is an unmanaged index of 500 widely held stocks that is generally considered representative of the U.S. stock market. Please note, direct investment in any index is not possible.

Share