![]() Contributed by: Angela Palacios, CFP®, AIF®
Contributed by: Angela Palacios, CFP®, AIF®
 Contributed by: Nicholas Boguth, CFA®, CFP®
The past few months have been a whirlwind—new leadership in Washington, escalating trade tensions, geopolitical conflicts, and market swings have dominated headlines. Even the Federal Reserve noted heightened 'uncertainty' after holding the Fed Funds Rate steady, and that might be an understatement.
The S&P 500 started out steady this year, gaining a few percent by mid-February and reaching a new all-time high! But the short-term whims of the stock market turned from that point as it fell sharply and briefly hit a 10% decline from its peak by mid-March (those famous "Magnificent 7" stocks got hit even harder, the notable one being TSLA that was down a whopping 53% from its high a few months prior). The S&P 500 ended at -4.5% this quarter.
While all that turmoil was occurring in the big U.S. stock names, international stocks were quietly having a fantastic quarter. The MSCI EAFE (a common stock index covering international stocks) was actually positive for the entire quarter, outperforming its U.S. counterpart by over 16% at times and ending the quarter at a positive +8%.
Bonds also did their job and provided the support we want to see during times of volatility, the Bloomberg U.S. Aggregate Bond Index added +3%.
If you were just watching the headlines, it may not have felt this way, but all of that adds up to a balanced portfolio* being essentially flat to start the year. U.S. stocks dragged down performance, while bonds and international stocks were additive. Our ultimate goal has always been to help you achieve your goals; therefore, we continue to focus on the risk reduction benefits of a diversified portfolio, and so far this year, the benefits of diversification have added up to a smoother ride.
*Morningstar's Moderate Allocation category average for the quarter was -0.3%.Source: Morningstar Direct.
Diversification
It is quarters like this that remind us why we invest in diversified portfolios and create a plan BEFORE there is market volatility.
Famed Nobel Laureate Harry Markowitz, whose investment principles still shape how portfolios are created today, said, "Diversification is the only free lunch in investing." We tend to agree, which is why we strongly believe in diversified portfolios. The only pushback I'd give is that it isn't "free"; it is actually very difficult for most investors to stay diversified. The hard part is that there is always a piece of your portfolio lagging, tempting you to second-guess it. Lately, that's been international stocks—but those who stayed the course just reaped the rewards of a quarter where international outperformed by more than 10%. Over the long haul, we believe diversification leads to favorable outcomes for investors, and we will continue to allocate accordingly.
Trade War Deja Vu
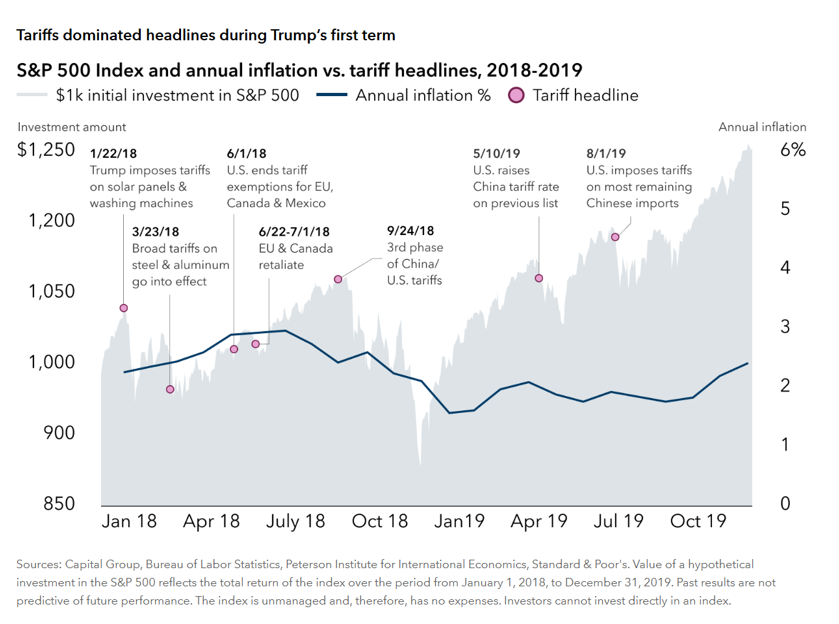
With all of the recent volatility directly induced by the trade war escalation, we have to look backward before deciding what, if anything, to do with portfolios. The most recent time period we have to look at from history is President Trump's first term when he tackled international trade, starting in late 2017 and continuing through into 2019. You can see that as various headlines escalated throughout the year, the market (the gray area) reacted mildly at first and even continued to climb higher through the summer as the war escalated. It is also important to remember that the volatility late in 2018 was not simply induced by the trade war. At the same time, the Federal Reserve (The Fed) took a tighter policy stance, increasing interest rates and giving forward guidance that it would continue to shrink its balance sheet.
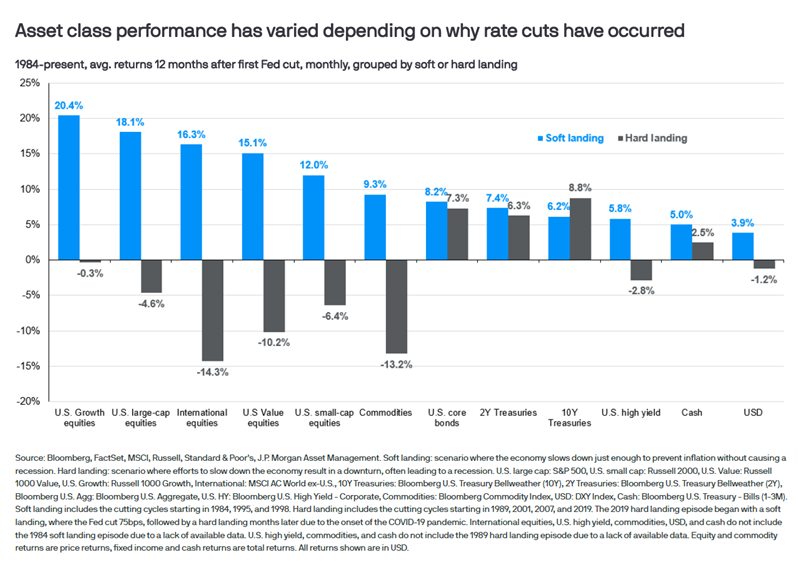
The difference this time is we have lived through this before, so markets are reacting poorly and more quickly than they did before. Perhaps because they are remembering what happened in 2018 and the volatility we saw at the end of the year was still fresh in investors' minds. What is lacking in all commentary we read, though, is experts and investors forget we had a HAWKISH Fed that was raising interest rates then. Now, we have a Fed that is expected to cut rates later this year.
How We Are Trading It?
As we have warned previously, media headlines are often wrong or sensationalized. But this doesn't mean that we ignore them and what is happening. As an investment committee, we digest and step back to calmly make decisions when warranted. So, what have we been up to?
Taking profits in positions that have been big winners. This may look different depending on what stage of life you are in and your portfolio needs, but for all, regardless of stage, it's called rebalancing. Rebalancing isn't just a process, it can also be a very tactical tool. We have let our winners run for a long time; once they were overweight, we shifted from US Large cap to areas like bonds (big winners recently) and into areas that underperformed for years like international (also big winners recently). This was done much nearer the market top for US Large before the recent volatility occurred.
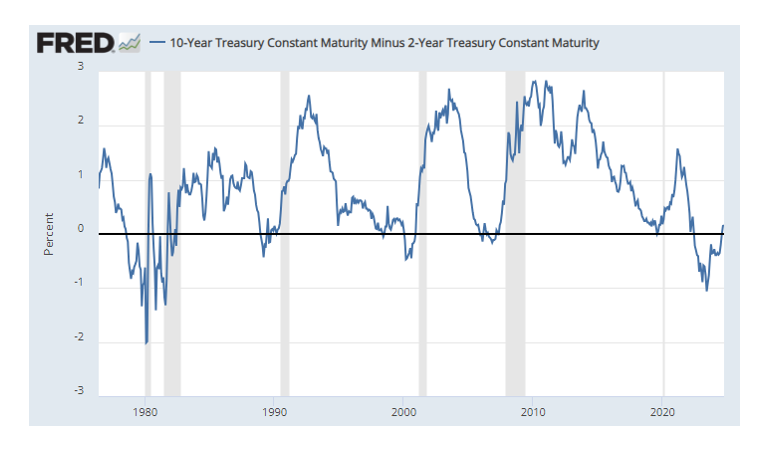
Lengthening duration in our bond portfolio now that intermediate term bonds are yielding more than short duration bonds. We harnessed that higher yield for your portfolio. Not to mention, some great price performance induced by market volatility recently too.
Raised cash for those in withdrawal stage. We did this early this year before the drawdown started. Taking advantage of a good start to the year for markets, we made sure people taking withdrawals had ample cash to fund future withdrawals, getting to sell while markets were up rather than being forced to sell down the road into weaker markets if they continued.
Remembering that portfolio management is not an "all or none" process is crucial. It is about positioning yourself to minimize emotional decisions so you can find the "opportunity" that exists in crisis. Stay tuned for more change to come in portfolios as we assess the consequence of tariffs, especially reciprocal tariffs, being put into place!
If you have questions, it is important that you reach out to your advisor. We recommend stepping back to remember your investment goals and ask yourself if those have changed. Remember, when we are doing your planning work, we expect times like this to occur, "when, why, and how much" are the surprise but not the "if." Our planning work knows this volatility occurs and builds cushion into your plan to be able to help manage periods like this.
Angela Palacios, CFP®, AIF®, is a partner and Director of Investments at Center for Financial Planning, Inc.® She chairs The Center Investment Committee and pens a quarterly Investment Commentary.
Nicholas Boguth, CFA®, CFP® is a Senior Portfolio Manager and Associate Financial Planner at Center for Financial Planning, Inc.® He performs investment research and assists with the management of client portfolios.
Any opinions are those of the Angela Palacios, CFP®, AIF® and Nick Boguth, CFA®, CFP® and not necessarily those of Raymond James. The information contained in this report does not purport to be a complete description of the securities, markets, or developments referred to in this material. There is no assurance any of the trends mentioned will continue or forecasts will occur. The information has been obtained from sources considered to be reliable, but Raymond James does not guarantee that the foregoing material is accurate or complete. Any information is not a complete summary or statement of all available data necessary for making an investment decision and does not constitute a recommendation. Investing involves risk and you may incur a profit or loss regardless of strategy selected. The S&P 500 is an unmanaged index of 500 widely held stocks that is generally considered representative of the U.S. stock market. The Russell 2000 Index measures the performance of the 2,000 smallest companies in the Russell 3000 Index, which represent approximately 8% of the total market capitalization of the Russell 3000 Index. The MSCI EAFE (Europe, Australasia, and Far East) is a free float-adjusted market capitalization index that is designed to measure developed market equity performance, excluding the United States & Canada. The EAFE consists of the country indices of 22 developed nations. The Bloomberg Barclays US Aggregate Bond Index is a broad-based flagship benchmark that measures the investment grade, US dollar-denominated, fixed-rate taxable bond market. Keep in mind that individuals cannot invest directly in any index, and index performance does not include transaction costs or other fees, which will affect actual investment performance. Individual investor's results will vary. Investing in oil involves special risks, including the potential adverse effects of state and federal regulation and may not be suitable for all investors. Past performance does not guarantee future results. Diversification and asset allocation do not ensure a profit or protect against a loss. Investing involves risk and you may incur a profit or loss regardless of strategy selected. Past performance is not a guarantee or a predictor of future results. Raymond James and its advisors do not offer tax or legal advice. You should discuss any tax or legal matters with the appropriate professional.
The Magnificent Seven are a group of companies including Alphabet, Amazon, Apple, Meta Platforms, Microsoft, NVIDIA, and Tesla. Raymond James makes a market in these stocks. This is not a recommendation to purchase or sell the stocks of the companies mentioned.


