Bonds

Investor Basics: Embedded Bond Features

Contributed by: Nicholas Boguth Nicholas Boguth

This time around in our “Investor Basics” series, we’re going to take a look at the most common bond features. For a dive into a more complex bond pricing topic, check out our Director of Investment’s Investor Ph. D blog on why buying premium bonds can make sense.

First off, what is an embedded bond feature?

An embedded bond feature is a provision attached to a bond that changes its maturity, risk, or liquidity. A bond issuer may release a bond with an embedded feature in order to make it more attractive to a bond buyer, or to give itself a more favorable debt structure. The most common types of embedded features that you may have seen in the market, and that I will briefly go over in this blog, are call, put, and conversions.

Call features give the issuer of the bond the right to “call” the bond back from the bondholder at a specific date. This provision benefits the issuer because they are able to buy back debt, and then issue new debt at a lower interest rate. A company will typically issue a callable bond when they believe that interest rates will decrease in the future. Since this feature benefits the issuer, the company will have to make the yield or maturity more attractive to entice a buyer.

Put features give the bondholder the right to “put” the bond back to the issuer at a specific date before it matures. This provision benefits the bondholder because it allows him or her to put the bond back to the issuer (maybe interest rates have risen or the company’s credit is deteriorating). Since this option benefits the bondholder, he or she may have to accept a lower yield or longer maturity on the bond.

Another common embedded bond feature is the conversion option. This actually lets the bondholder convert the bond into shares of the company’s stock at a predetermined price and date. A company may issue convertible bonds as a way to issue cheap debt (they may not have to pay as large of a coupon because they are giving the bondholder the option to convert their bond to stock).

Each of these bond features may have a place in an investor’s portfolio, but knowing when and how to include them can be complex and differs from investor to investor. If you have any questions on these bond topics or any others, feel free to reach out to us at any time!

Nicholas Boguth is an Investment Research Associate at Center for Financial Planning, Inc.® and an Investment Representative with Raymond James Financial Services.


The information contained in this report does not purport to be a complete description of the securities, markets, or developments referred to in this material. Any information is not a complete summary or statement of all available data necessary for making an investment decision and does not constitute a recommendation. Every investor’s situation is unique and you should consider your investment goals, risk tolerance and time horizon before making any investment. Investing involves risk and you may incur a profit or loss regardless of strategy selected. Investments mentioned may not be suitable for all investors. There is an inverse relationship between interest rate movements and fixed income prices. Generally, when interest rates rise, fixed income prices fall and when interest rates fall, fixed income prices generally rise.

Asset Flow Watch 2Q 2017

Contributed by: Jaclyn Jackson Jaclyn Jackson

One of the most common ways to monitor consumer confidence and investor sentiment is to watch fund inflows and outflows. Market analysts use fund flows to measure sentiment within asset classes, sectors, or markets. This information (combined with other economic indicators) help identify trends and determine investment opportunities.

A new trend may be emerging as international fund flows are outpacing US fund flows in the second quarter. The move towards taxable bonds that began in January 2017 continued as investors have handled high U.S. stock valuations gingerly.

Asset Flows: What Investors Did This Quarter

An even distribution of flows went towards taxable bonds and international equities in April. The fear of France’s exit from the European Union dissipated as Emmanuel Macron won the French presidential elections. Accordingly, flows moved into foreign large blend funds. To boot, MSCI Emerging Markets Index returns (13.9%) increased inflows to diversified emerging markets. On the other hand, first quarter GDP growth (0.7%) and political unpredictability sucked life from post-election US equity inflows. 

By May, US equity deceleration evolved into outflows. International equity flows remained strong.  Taxable bond flows continued in spite of raised rates. Republican tax cut plans created municipals bond outflows; likely because investors don’t think federal tax exemptions will be as advantageous as they have been in the past. 

Early quarter trends have continued through June. As of June 21, 2017, US equity outflows were -$1.205 billion, international equity inflows were $1.467 billion, emerging markets inflows were $0.300 billion, and taxable bond inflows were $3.016 billion.

Is the US Equity Run Over?

While the debate about the end of the US equity run ensues among industry professionals, the discussion may be mute among investors. It appears that many investors, figuring the US recovery is further along than the rest of the world, have opted to either “play it conservative” with bonds or invest internationally where there is seemly more opportunity for equity values to grow.

Jaclyn Jackson is a Portfolio Administrator and Financial Associate at Center for Financial Planning, Inc.®


This information does not purport to be a complete description of the securities, markets, or developments referred to in this material; it has been obtained from sources considered to be reliable, but we do not guarantee that it is accurate or complete. Any opinions are those of Jaclyn Jackson and are not necessarily those of Raymond James. This information is not a complete summary or statement of all available data necessary for making and investment decision and does not constitute a recommendation. Investing involves risk, investors may incur a profit or loss regardless of the strategy or strategies employed. International investing involves special risks, including currency fluctuations, differing financial accounting standards, and possible political and economic volatility. Investing in emerging markets can be riskier than investing in well-established foreign markets. Asset allocation does not ensure a profit or guarantee against loss. Past performance is not a guarantee of future results. The MSCI Emerging Markets is designed to measure equity market performance in 25 emerging market indices. The index's three largest industries are materials, energy, and banks. Please note direct investment in any index is not possible.

Investment Basics: Bonds 101

Contributed by: Nicholas Boguth Nicholas Boguth

Bonds are a hot topic in the investment community today while we patiently await a rise in interest rates from the Fed. We know that interest rates affect the bond market, but how? In order to truly gain a better understanding of how the bond market works, we’re going back to the basics to address some important fundamental questions that all investors should understand.

First off, what is a bond?

A bond is a debt instrument that a company or government uses to borrow money. A corporation may need cash in order to build new factories; a government may need cash to build a bridge, etc. In order to borrow money, they sell you (the investor) a bond that basically says, “We owe you.” By selling these bonds, they are able raise a large amount of cash, and pay it back over time.

It is important to note that the major difference between bonds and stocks is that bonds are debt, and stocks are equity. If you own a bond, you own a portion of the issuer’s debt. If you own a stock, you own a portion of the company. The upside of owning a bond is that you receive back principal plus interest; you have higher priority for getting paid if the issuer goes bankrupt, and you don’t lose money because the stock price declines. The downside is that you don’t share the issuer’s future profits or participate in rising stock prices. These factors are why bonds are typically considered “less volatile” investments.

What is a coupon?

Bonds pay interest to you, the investor. A coupon is simply the amount of money that you receive at each interest payment (typically every six months). Par value, or the issuer’s price of a bond, is typically $1000. If a bond has a 5% coupon, then you receive 5% of $1000 every year; or $25 every 6 months.

What is yield?

A bond’s yield is a measure of its return. Current yield is calculated by taking the coupon payment and dividing by the current price of the bond. When a bond is trading at par, rather than at a discount or premium, the yield is equal to the coupon payment: $50 coupon payment/$1000 bond price = 5% yield. If the price of that same bond rose to $2000, then the current yield would be $50/$2000 = 2.5%. The yield is lower because you had to pay more money for the bond. The opposite would be true if you bought the bond at a discount. The Yield to maturity is another measure of return. It reflects the return you would get if you held the bond all the way to maturity. For you investors, it is important to understand what coupons and yields are in order to understand their relationship to pricing and interest rate changes.

Why do bond prices go down when interest rates go up?

When interest rates rise, new bonds that are being issued will have higher coupon payments than the old bonds that were issued in the lower interest rate environment. Why would anyone ever buy one of those old bonds that have smaller coupons? If they were the same price, they wouldn’t! This is why bond prices fall when interest rates rise. In order for the yield to be equal between the bond with the higher coupon and the bond with the smaller coupon, the bond with the smaller coupon would have to be cheaper.

Nicholas Boguth is a Client Service Associate at Center for Financial Planning, Inc.


This material is being provided for information purposes only and is not a complete description, nor is it a recommendation. The information has been obtained from sources considered to be reliable, but we do not guarantee that the foregoing material is accurate or complete. Any opinions are those of Nick Boguth and not necessarily those of Raymond James. Investments mentioned may not be suitable for all investors. Investing involves risk and investors may incur a profit or a loss. The hypothetical examples are for illustration purpose only and do not represent an actual investment.

There are special risks associated with investing with bonds such as interest rate risk, market risk, call risk, prepayment risk, credit risk, reinvestment risk, and unique tax consequences. To learn more about these risks and the suitability of these bonds for you, please contact our office.

Investor Education Ph.D. series: What is Roll Yield?

Contributed by: Angela Palacios, CFP® Angela Palacios

Roll yield is a term that you may have heard lately in the financial news.  No, I am not talking about Cubans and cigars.  I am referring to a potentially profitable bond trading strategy that can be employed to enhance returns of a bond portfolio during a rising interest rate environment.

The Traditional Buy and Hold Bond Strategy

With interest rate increases supposedly just around the corner, investors fear negative or very low returns out of their bond positions.  Furthermore, there are many proponents of buying individual bonds only during a rising interest rate environment.  This strategy offers certainty of getting your principal back upon maturity if the creditor doesn’t default. However, when the bond yield curve is sloping upward there is another strategy that could be employed successfully and potentially create better long term returns than the buy and hold strategy.

How the Roll Yield Bond Strategy is Different

Roll yield is often thought of hand-in-hand with the futures market. In the futures market when you are buying a contract on the price of coffee for example, you are always paying either more or less then coffee is actually trading at in that moment (this is referred to as the spot price).  If you are paying less for the contract than the current spot price, you can then achieve a positive roll yield or price increase as that contract gets closer and closer to maturing at the spot price (assuming the spot price doesn’t change) as shown by the green line in the chart below.

In the bond market this concept is similar but works a bit differently.  When you buy a bond, for example a 5 year treasury bond, you pay $1,000 for this bond and in return get a set rate of interest, I will use1.75% for example.  If the yield curve is upward sloping that means that bonds maturing in less than 5 years should pay some interest rate less than 1.75% as you aren’t tying your money up for as long.  For example, a 4-year bond could yield 1.5%.  See the chart below for an example of an upward sloping yield curve.

As you hold your 5-year treasury it grows closer to maturity every day and eventually your 5 year bond turns into a 4 year bond, 3 year bond and so on until it matures.  If rates don’t change over the first year, you now possess a 4 year bond that yields 1.75% when all other 4-year treasury bonds that are issued are only paying 1.5%.  The interest rate premium means people want your bond more and are willing to pay more money for it.  This results in price appreciation or a capital gain on the bond.  At that time, you could sell the bond and collect the price appreciation in addition to the 1.75% in interest that you collected over the past year. 

The chart below shows a hypothetical example of owning 100 of these bonds.  The blue area is the 1.75% interest that you receive each year.  You can see that it stays level each year until maturity.  However, in the first year you see that there is a red area, or addition to your return, from capital gains of the price going up due to the nature of the process explained above.  You could sell your 100 bonds that in 4 years will mature again at $100,000 or sell it for $101,000 and over the first year collect a total of $1,750 in interest plus $1,000 in capital gains making your return on the $100,000 investment.

Then you could re-invest in a new 5 year bond still paying 1.75% interest again.  The reason you may want to make this transaction is when you get closer to the bond maturing you will have to lose that increase in price because you will only receive your $1,000 back from the US Treasury that you paid originally for the bond and therefore, the bond price will come back down as investors know this will happen and will be unwilling to pay more for the bond.  This is shown in the chart above as the annual loss (red area) in years 4 and 5 on the bond.

Large Bond Managers vs. the Individual Investor

A buy-and-hold investor would give up this potential increase in returns in the early years of holding the bond by not selling and locking in the price appreciation.  However, this strategy can be difficult to pay off for an individual investor because you are dealing in smaller lots of individual bonds and thus you pay commissions and are subject to bid/ask spreads that could make it too costly to trade and take advantage of roll yield.  Large bond managers can often successfully pull this off because they have pricing power due to the sizes of the bond lots they trade.

If rates rise too quickly or only certain parts of the yield curve increase, this type of strategy may not pay off over a buy-and-hold investor.  An investor needs to weigh whether or not they would prefer the certainty of the individual bond or if they would prefer to outsource to a manager to implement potential strategies such as roll yield to enhance returns over time.

Angela Palacios, CFP® is the Portfolio Manager at Center for Financial Planning, Inc. Angela specializes in Investment and Macro economic research. She is a frequent contributor to Money Centered as well as investment updates at The Center.


Sources: http://www.futurestradingpedia.com/futures_roll_yield.htm https://www.kitces.com/blog/how-bond-funds-rolling-down-the-yield-curve-help-defend-against-rising-interest-rates/

This material is being provided for information purposes only and is not a complete description, nor is it a recommendation.The information has been obtained from sources considered to be reliable, but we do not guarantee that the foregoing material is accurate or complete. The information contained in this report does not purport to be a complete description of the securities, markets, or developments referred to in this material. Any opinions are those of Angela Palacios and not necessarily those of Raymond James. Investing always involves risk, including the loss of principal, and futures trading could present additional risk based on underlying commodities investments. There are special risks associated with investing with bonds such as interest rate risk, market risk, call risk, prepayment risk, credit risk, reinvestment risk, and unique tax consequences. To learn more about these risks and the suitability of these bonds for you, please contact our office.

Where to look for Bond Yield

Finding yield has become a struggle for investors today.  At the beginning of 2014, most experts were expecting the yield on U.S. 10-year Treasuries to end the year well above 3%.  However, they ended up going down from where they started the year and finished at 2.2% (and are even lower today).  Many were left scratching their heads as to why this could have happened.  However, when you look at the high quality government bond options around the would you can start to understand why. It’s all relative. 

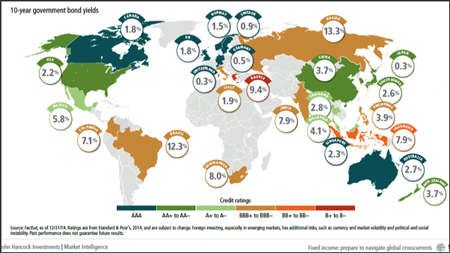
Mapping 10-year Government Bond Yields

First of all, not much of the world is considered “high quality”.  The turquoise countries in the graphic below are the only countries that receive the coveted AAA rating.  This includes Canada, Australia, Singapore and much of Europe.  There are a few countries in the AA rating, or bright green color coding camp, which is where the United States falls. 

Second, look at the yields these countries pay.  Of the AA and AAA rated countries, U.S. Treasuries at 2.2% have the most attractive rates for the credit quality and also perceived quality by others.  Would you want to buy 10-year Chinese government bonds for only 1.5% more yeild over the U.S. (3.7% versus 2.2%)?  The answer is generally no with the bulk of your fixed income assets.

20150205c.jpg

Many governements, institutions and pension funds agree.  So U.S. bonds are aggressively bought when their rates go up, even a little, by institutions and governments because they are a safe haven with the best relative yields out there. This buying then drives the rates right back down again.  The blue bars on the chart below show month-by-month how many trillions of U.S. Treasuries are owned by foreign governments.  You can see as tapering occurred (indicated by the green boxes in $’s), the U.S. pulled back on the amount of bonds it was buying, then yields would spike (see the purple line) and foreign governments would buy.

20150205d.jpg

Now, with Europe embarking on its own bond buying program, yield curves and thus rates in Europe are going to come down even further. This is likely to make this phenomena even more pronounced.  For at least the near term, it is likely we will be stuck with lower rates here in the U.S. and around the world as these trends persist.

Angela Palacios, CFP®is the Portfolio Manager at Center for Financial Planning, Inc. Angela specializes in Investment and Macro economic research. She is a frequent contributor to Money Centered as well asinvestment updates at The Center.

This material is being provided for information purposes only and is not a complete description, nor is it a recommendation. Any opinions are those of [insert FA name] and not necessarily those of Raymond James. The information has been obtained from sources considered to be reliable, but Raymond James does not guarantee that the foregoing material is accurate or complete. There are special risks associated with investing in bonds (fixed income) such as interest rate risk, market risk, call risk, prepayment risk, credit risk, and reinvestment risk. There is an inverse relationship between interest rate movements and fixed income prices. Generally, when interest rates rise, fixed income prices fall and when interest rates fall, fixed income prices generally rise. International investing involves special risks, including currency fluctuations, different financial accounting standards, and possible political and economic volatility. C15-003427

3 Reasons Municipal Bonds are Darlings of the Year

While bond returns have astounded investors so far this year, many are left scratching their heads wondering if interest rates are ever going to rise creating the “Bond Armageddon” that has been so highly anticipated.  On November 17th the Barclays US Aggregate Bond index total return has returned 5.13% year-to-date1.  While that is certainly an attractive return on something that was destined to be down this year, municipal bonds have astounded even more.  As of November 17th the Barclays Municipal total return index1 has experienced a cool 8.06% return.  Is it time then to give up on municipal bonds after this return that seems like it should be unreal?  The short answer is no.

Why not to give up on municipal bonds

The municipal bond market offers three unique traits that continue to make it attractive. 

1. Taxes:  Paying taxes are always a concern for investors, so the tax advantaged nature of municipal bonds continue to make them attractive, especially as tax rates increase for the wealthy.

2. Supply is limited:  The chart below demonstrates how the number of municipal bonds available to purchase is getting smaller.  The light teal bar below zero shows the amount of bonds each month that have been redeemed (called away or matured giving the investor their principal back).  The purple bar above shows the number of new bonds being issued each month.  The blue line shows the net number of issues or redemptions (number of new issues subtracting the number of redemptions).  In most months over 2012 and 2013, the number is negative meaning the number of bonds out there for investors to purchase is getting smaller.  A limited supply with demand that stays steady or increases can create positive returns for bondholders.

Source: Columbia Management

3. Yields: When comparing two bonds of similar quality (bond rating) and the municipal bond is yielding about the same or more and the interest is tax free2, which bond would you choose?  Many investors have made that very same decision.

Three main things to consider before investing in municipal bonds:

  • May provide a lower yield than comparable investments

  • Are likely not suitable for investors who do not stand to benefit from the tax advantages

  • Are subject to certain risks, including interest rate, credit, legislative, reinvestment and valuation risks

As with any investment, the decision to own municipal bonds is not one to be taken lightly.  As always don’t hesitate to ask us to see if they make sense for your portfolio. 

Angela Palacios, CFP®is the Portfolio Manager at Center for Financial Planning, Inc. Angela specializes in Investment and Macro economic research. She is a frequent contributor to Money Centered as well asinvestment updates at The Center.

1: Source: Morningstar Direct. Barclays US Aggregate Bond Index represents investment grade bonds being traded in United States. Barclays Municipal total return index represents the broad market for investment grade, tax-exempt bonds with a maturity of at least one year. Individuals cannot invest directly in any index, and index performance does not include transaction costs or other fees, which will affect actual investment performance. Individual investor’s results will vary. Past performance does not guarantee future results.

2: Municipal bond interest is not subject to federal income tax but may be subject to AMT, state or local taxes. Income from taxable municipal bonds is subject to federal income taxation; and it may be subject to state and local taxes. Please consult an income tax professional to assess the impact of holding such securities on your tax liability.

The market value of municipal bonds may fluctuate and, if sold prior to maturity, the price you receive may be more or less than the original purchase price or maturity value. There is an inverse relationship between interest rate movements and fixed income prices. This material is being provided for information purposes only and is not a complete description, nor is it a recommendation. Any opinions are those of Center for Financial Planning, Inc. and not necessarily those of Raymond James. The information has been obtained from sources considered to be reliable, but Raymond James does not guarantee that the foregoing material is accurate or complete. C14-036843

Heeding Warnings on Bonds - 2nd Quarter 2012

As an Investment Committee and firm, we have had concerns about the threat of rising interest rates for some time. The growing chorus of concern for future bond returns rose during the quarter including notable discussion from Warren Buffett in his annual Berkshire shareholder letter. 

Over the past 30 years, bonds have been a significant contributor to investor returns. It takes a veteran investor with a long memory to recall the last time that there were sustained negative real returns for bonds. Coming out of the 1970s, inflation was the chief enemy of the Fed and interest rates remained higher than inflation rates. This meant that even those investing in cash alternatives could preserve the purchasing power of their investments.

invcom_fredgraph.png

We all know what’s happened to the rate of return for cash alternatives since 2008. It has been brutal to pay your bank more in fees to hold your money than receiving back as savings interest rates which have been negligible or nonexistent. Since inflation has hovered between two and three percent, your cash alternative has had a negative real rate of return, that is the return of the investment minus inflation.

Our concern today is that this negative real rate will spread from cash alternatives to other bond categories, most notably US government bonds. There are several ways that bond results can hurt investors:

  • Rates rise: As interest rates rise, the price of bonds may go lower. This might result in reduced portfolio values on statements.
  • Rates stay flat, inflation rises: Interest rates don’t have to rise to experience disappointing bond returns. A hidden threat is that interest rates remain extremely low while inflation rises. If you subtract the high inflation from low returns in bonds, you may end up with a negative real rate of return as mentioned below.
  • Economic deterioration: Investors who move away from bonds that are more sensitive to interest rates in favor of credit risk sensitive bonds may be disappointed if slowing economic factors result in lower bond prices for bond diversifiers.

With baby boomers retiring, the bond conundrum really hits home. A historically tried and true source of retirement income may now be a source of risk. As one investor noted, this means portfolios may need to be much more carefully constructed and complex than they were in the past.

Some specific recommendations:

  • Asset allocation: Carefully review allocation decisions with your financial planner and make sure that you are invested for the next 30 years and not the last 30 years. This is especially important if you’ve significantly altered your overall allocation in the wake of the market meltdown of 2008.
  • Diversification: Not all bonds behave the same. Many types of bonds that did not exist in the last great rising rate environment of the 1970s may offer some aid to investors, or be the best option in a lousy lot. Bonds outside of the US should also be considered. Lower volatility alternative asset classes might also be included in the potentially “better than bond category”, although they take careful consideration and analysis. With diversification comes risk and complication, professional advice is recommended.
  • Rethink income strategy: Bond coupons are not the only source of income for an investor portfolio. Stocks which pay dividends are one alternate source. Beyond that, we generally prefer a total return view where both appreciation and income can be used for portfolio withdrawals depending on which assets are overweight. This reinforces the buy low and sell high concept.

We have been discussing the threat of rising rates so much, that I feel like a broken record. Someday I will talk about a time when you could get a mortgage at 3.5%. It might sound as crazy to a younger audience as double-digit Certificates of Deposit rates sound today – something that is very difficult, if not impossible, to wrap my head around. Preparing for the shifting reality of bond returns is the highest priority of our investment committee today!

Any information is not a complete summary or statement of all available data necessary for making an investment decision and does not constitute a recommendation. Any opinions are those of Melissa Joy and not necessarily those of RJFS or Raymond James. Expressions of opinion are as of this date and are subject to change without notice. Investments mentioned may not be suitable for all investors. Past performance may not be indicative of future results. There is an inverse relationship between interest rate movements and bond prices. Generally, when interest rates rise, bond prices fall and when interest rates fall, bond prices generally rise. Diversification and asset allocation do not ensure a profit or protect against a loss. Please note that international investing involves special risks, including currency fluctuations, different financial accounting standards, and possible political and economic volatility. Dividends are not guaranteed and must be authorized by the company’s board of directors. Every investor’s situation is unique and you should consider your investment goals, risk tolerance and time horizon before making any investment. Investing involves risk and you may incur a profit or loss regardless of strategy selected.

Bonds - 1st Quarter 2012

invcom_bonds_chart.jpg

Source: Morningstar, Inc.

It seems like bonds are defying gravity at this point.  Entering last year at near record lows for yields, fixed income, as measured by the widely recognized BarCap Aggregate Bond Index, returned 7.8% vs. virtually flat returns for large-cap stocks as measured by the S&P 500. As bond returns continued to levitate, yields deflated to new record levels.  US debt was downgraded mid-year, but markets asserted a strong vote of confidence with double-digit returns for long treasury bonds.

Where to next? Past returns are not a predictor of future performance – that’s what we’re told to say by our compliance officers and in my mind, this disclaimer could not be more apropos. With interest rates telegraphed to remain low, the Fed may delay dreaded rising rates, but the ability to replicate the returns of 2011 will be a major surprise. Diversification away from a traditional mix of government bonds may help, depending on your situation.